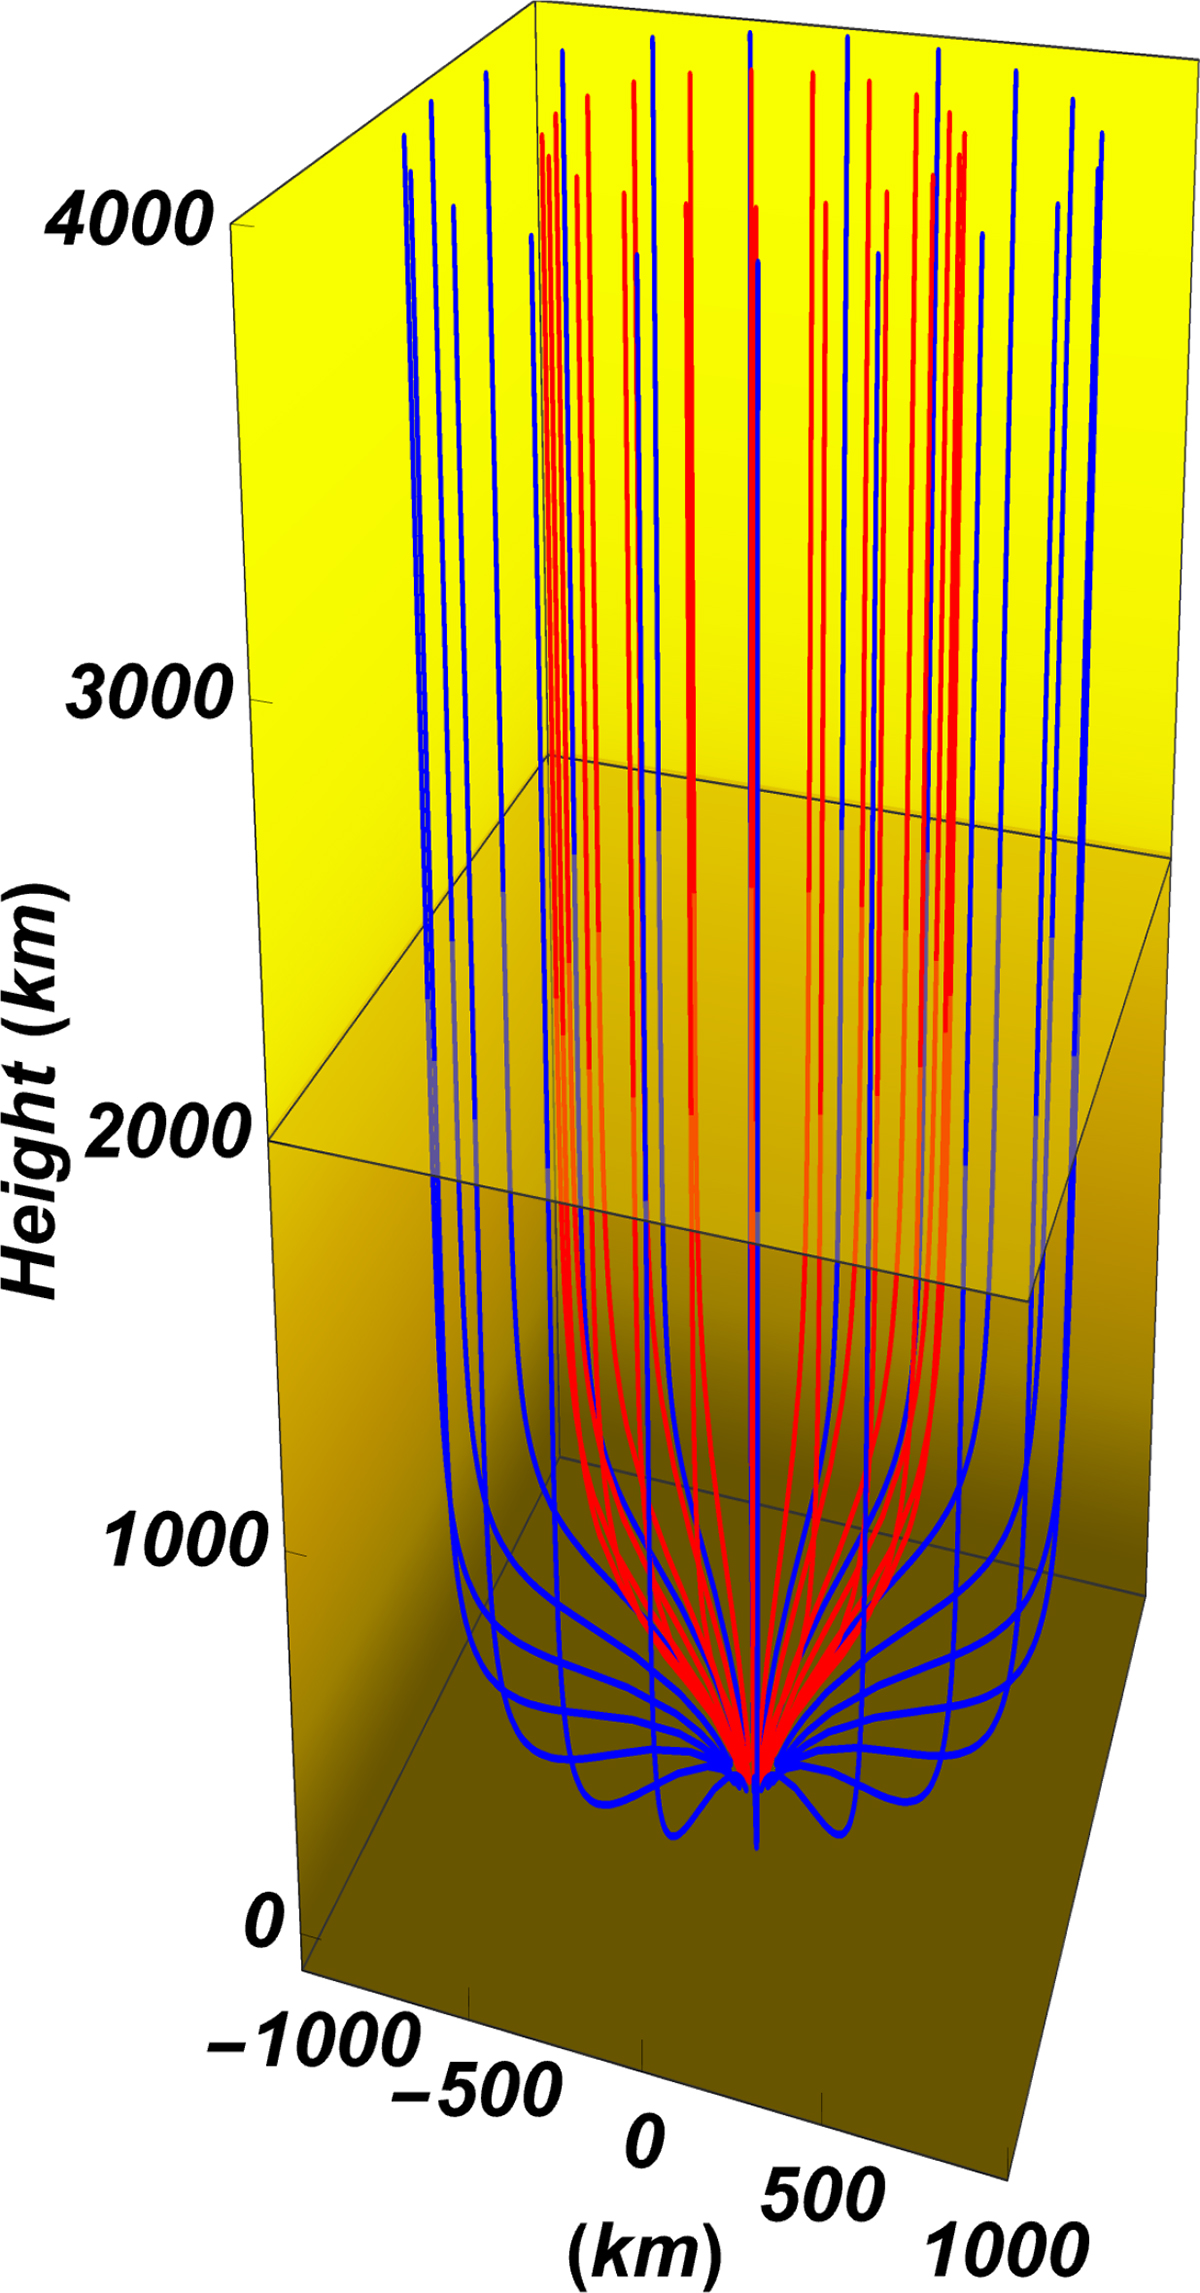
Fig. 1.
Download original image
Equilibrium magnetic flux tube model embedded in the background atmosphere. The red and blue lines outline some selected magnetic field lines that cross the photosphere at 40 km and 70 km from the tube axis, respectively. The color gradient illustrates the density stratification from the photosphere (brown) to the low corona (yellow). The transition region height is marked by a horizontal, semitransparent plane. For visualization purposes, the horizontal and vertical directions are not to scale.
Current usage metrics show cumulative count of Article Views (full-text article views including HTML views, PDF and ePub downloads, according to the available data) and Abstracts Views on Vision4Press platform.
Data correspond to usage on the plateform after 2015. The current usage metrics is available 48-96 hours after online publication and is updated daily on week days.
Initial download of the metrics may take a while.