Fig. 1
Download original image
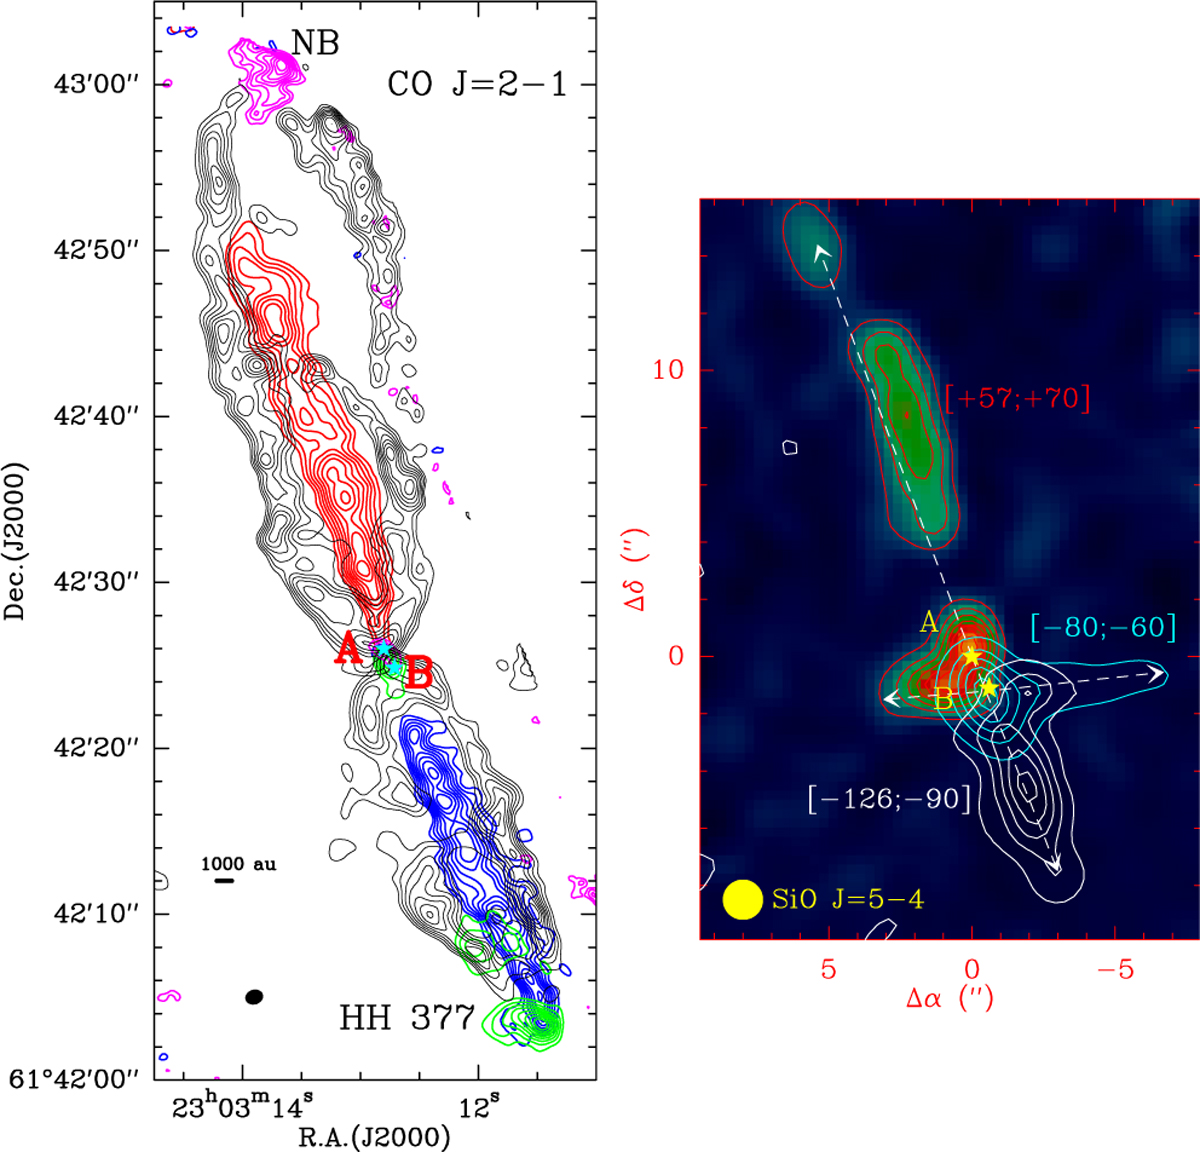
Left: CO J= 2–1 emission detected in the Cep E protostellar core with the IRAM interferometer at 1″ (820 au) resolution. The black contours trace the emission from the low-velocity gas (|V −Vlsr| < 8 km s−1), and the blue/red contours trace the high-velocity jet (V − Vlsr > 50 km s−1, powered by component A of the Cep E protostellar core. The data are from Lefloch et al. (2015) and de A. Schutzer et al. (2022). Right: SiO J= 5–4 emissions detected in the Cep E protostellar core with the IRAM interferometer at 1.4″ (1150 au) resolution in the jets powered by protostars A (red and white contours) and B (blue and red contours). The velocity intervals of integrated flux are reported (in km s−1) next to the lobes of the jets from A and B. The first contour and contour interval are 10% and 20% of the maximum peak intensity. The data are from Ospina-Zamudio et al. (2018).
Current usage metrics show cumulative count of Article Views (full-text article views including HTML views, PDF and ePub downloads, according to the available data) and Abstracts Views on Vision4Press platform.
Data correspond to usage on the plateform after 2015. The current usage metrics is available 48-96 hours after online publication and is updated daily on week days.
Initial download of the metrics may take a while.