Fig. 11
Download original image
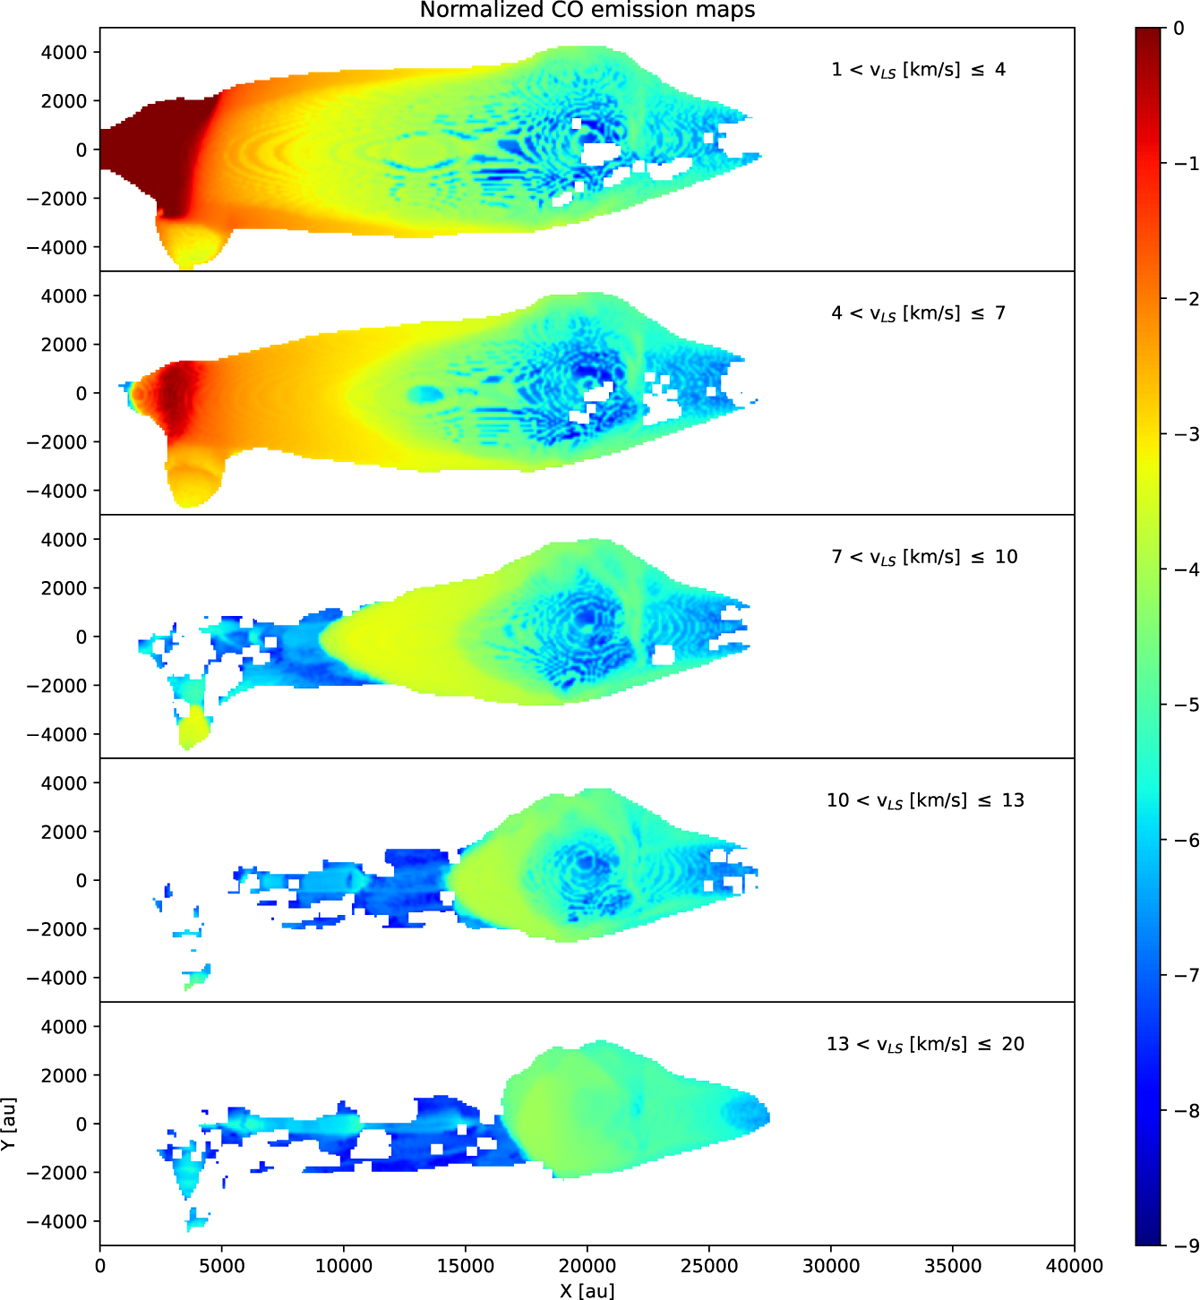
Emission of M2 model considering channels of velocities. For these maps, the velocities in the direction of the observer were considered. The upper panel shows the emission for the velocities between 1 and 4 km s−1. The emission delineates the outer cavity walls, including the bubble generated by the secondary jet in the bottom left corner. On the other hand, a second bubble can be noticed showing the lack of emission at a distance of 2 × 10⁴ au. The second panel, 4 and 7 km s−1, shows the inner cavity walls and the leading shock, like the secondary bubble, shows no emission in this velocity range. The third panel, showing the emission between 7 and 10 km s−1, allows us to observe more emission inside both bubbles, and near the base it shows that the main jet’s outer layer can trace the deviation due to the collision between the flows. The fourth and fifth panels present the higher velocities, between 10 and 13 km s−1 and 13–20 km s−1, respectively. The emission is stronger in the leading part, meaning a significant expansion exists.
Current usage metrics show cumulative count of Article Views (full-text article views including HTML views, PDF and ePub downloads, according to the available data) and Abstracts Views on Vision4Press platform.
Data correspond to usage on the plateform after 2015. The current usage metrics is available 48-96 hours after online publication and is updated daily on week days.
Initial download of the metrics may take a while.