Open Access
Fig. 2
Download original image
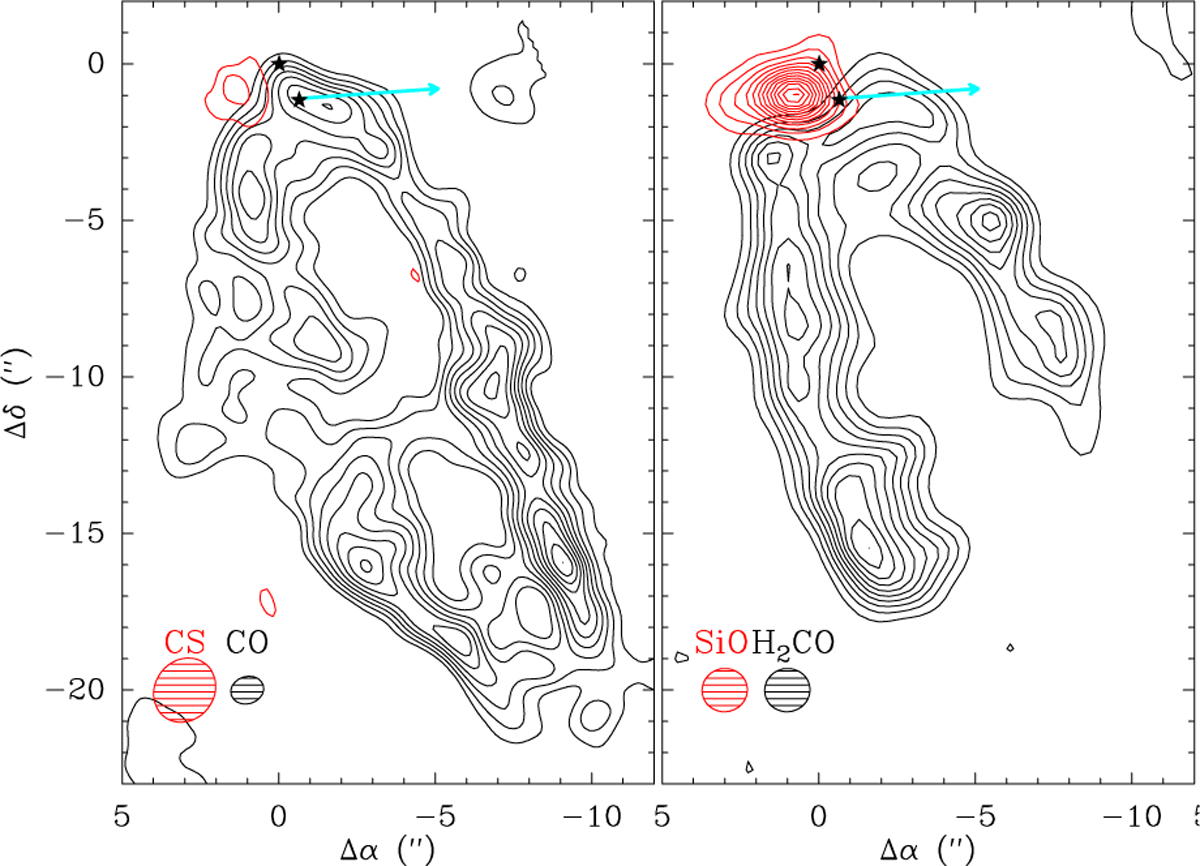
Interaction between southern low-velocity outflow lobe of A, at [−8; −6] km s−1 (black contours) and the eastern lobe of the jet from B (red contours), as observed with the IRAM interferometer in the molecular lines of CO J=2–1 and CS J=2–1 (left), and SiO J=2–1 and H2CO (right).
Current usage metrics show cumulative count of Article Views (full-text article views including HTML views, PDF and ePub downloads, according to the available data) and Abstracts Views on Vision4Press platform.
Data correspond to usage on the plateform after 2015. The current usage metrics is available 48-96 hours after online publication and is updated daily on week days.
Initial download of the metrics may take a while.