Open Access
Fig. 3
Download original image
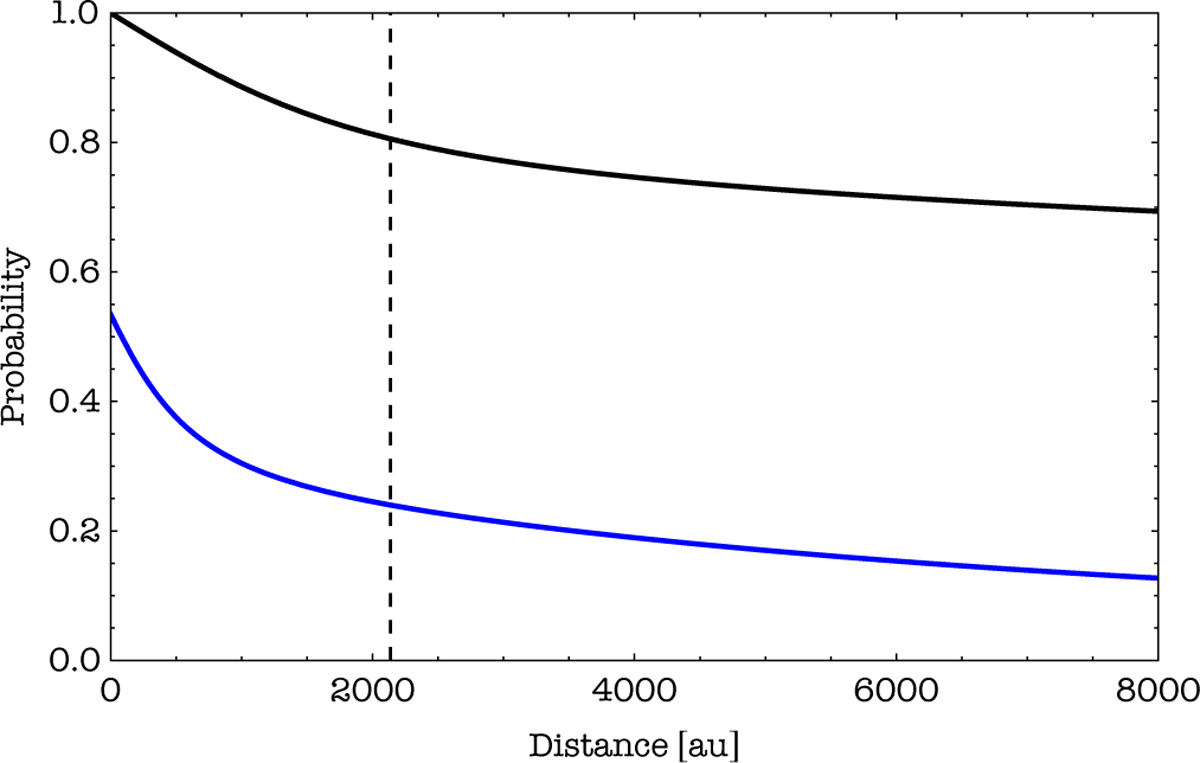
Probability of two outflows overlapping for two wide cavities (continuous black line) and for two collimated jets (blue line). The dashed line represents the observed separation of Cep E-A and Cep E-B, which could be larger because of projection effects.
Current usage metrics show cumulative count of Article Views (full-text article views including HTML views, PDF and ePub downloads, according to the available data) and Abstracts Views on Vision4Press platform.
Data correspond to usage on the plateform after 2015. The current usage metrics is available 48-96 hours after online publication and is updated daily on week days.
Initial download of the metrics may take a while.