Fig. 3.
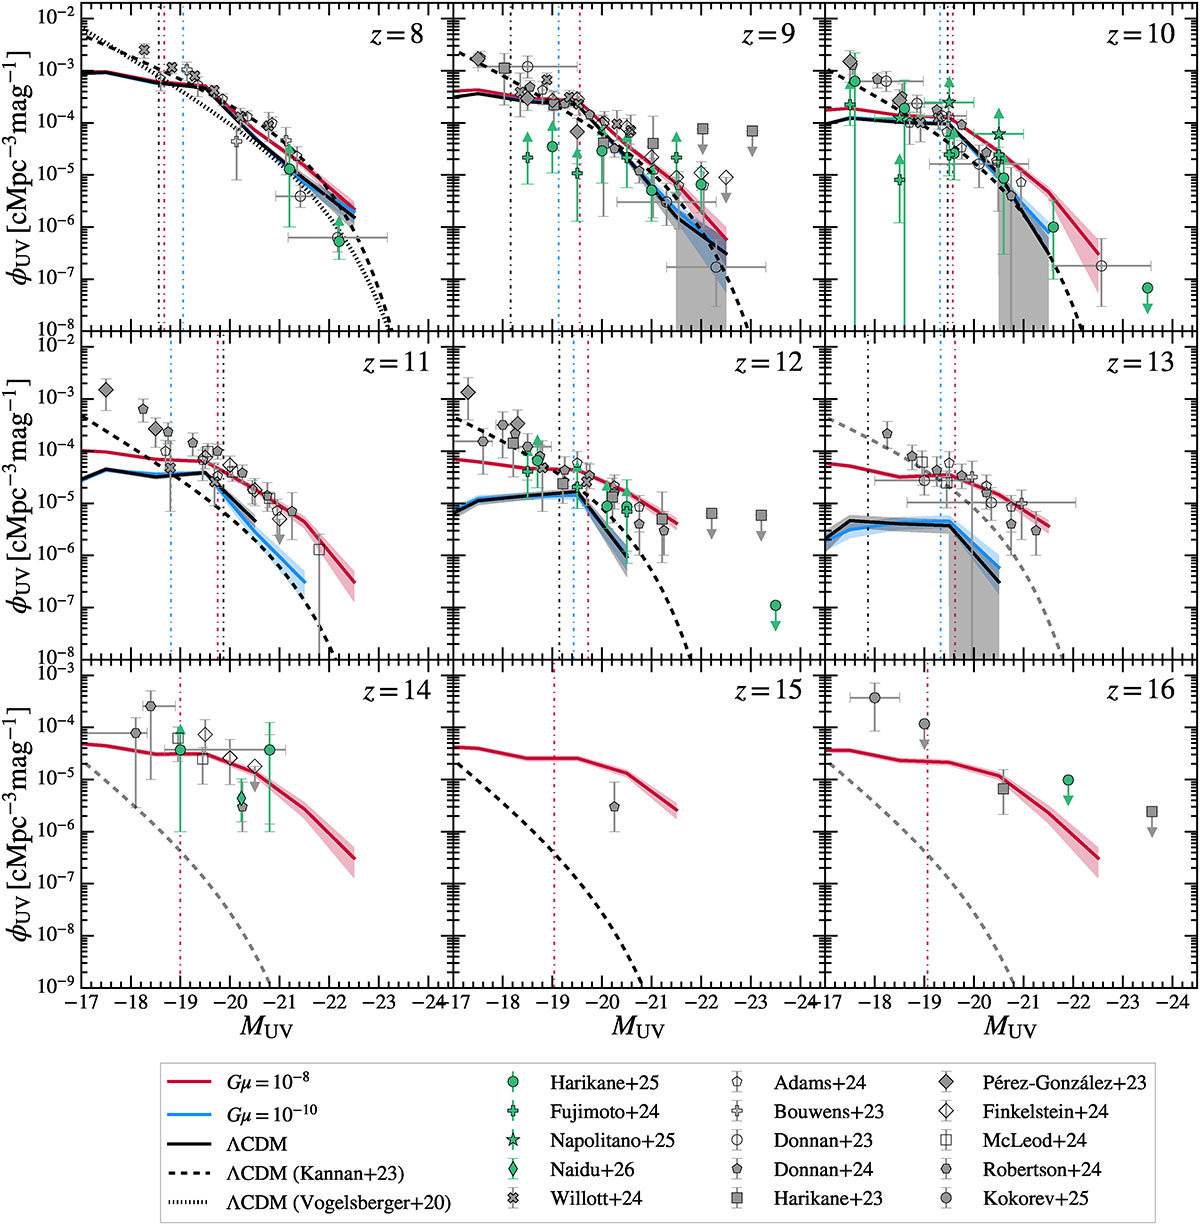
Download original image
Dust-attenuated UV luminosity functions from our baseline ΛCDM run (solid black curves) and modified runs modeling cosmic strings with string tension Gμ = 10−8 (solid red curves) and Gμ = 10−10 (solid blue curves) with corresponding Poisson errors (shaded error bands) at redshifts z = 8 − 16. Dash-dotted vertical lines in the corresponding colors indicate the median UV magnitude of galaxies in the first 95% complete halo mass bin (see Sect. 3.1 for details). At significantly fainter magnitudes than this, the simulation results are expected to be strongly affected by resolution artifacts. Dashed and dotted black curves show Schechter fits of the dust-attenuated UV luminosity functions from higher-resolution and larger-volume ΛCDM simulations using the same code base and galaxy formation model as our runs (K23; Vogelsberger et al. 2020). We note that we show data from the closest available K23 output redshift zK23 for z = 13 (zK23 ∼ 12), as well as for z = 14 and z = 16 (zK23 ∼ 15), and indicate these redshift discrepancies with a reduced opacity of the dashed curve. Green and gray symbols show observational estimates from spectroscopically confirmed (Harikane et al. 2024, 2025; Fujimoto et al. 2024; Napolitano et al. 2025; Naidu et al. 2026) and photometric (Bouwens et al. 2023; Donnan et al. 2023; Harikane et al. 2023a; Pérez-González et al. 2023; Adams et al. 2024; Donnan et al. 2024; Finkelstein et al. 2024; McLeod et al. 2024; Robertson et al. 2024; Willott et al. 2024; Kokorev et al. 2025) JWST data, respectively. Where applicable, these estimates are plotted at the closest integer redshift. At high redshifts z ≳ 11, the observations appear to be in significantly better agreement with the Gμ = 10−8 results than the ΛCDM and Gμ = 10−10 predictions.
Current usage metrics show cumulative count of Article Views (full-text article views including HTML views, PDF and ePub downloads, according to the available data) and Abstracts Views on Vision4Press platform.
Data correspond to usage on the plateform after 2015. The current usage metrics is available 48-96 hours after online publication and is updated daily on week days.
Initial download of the metrics may take a while.