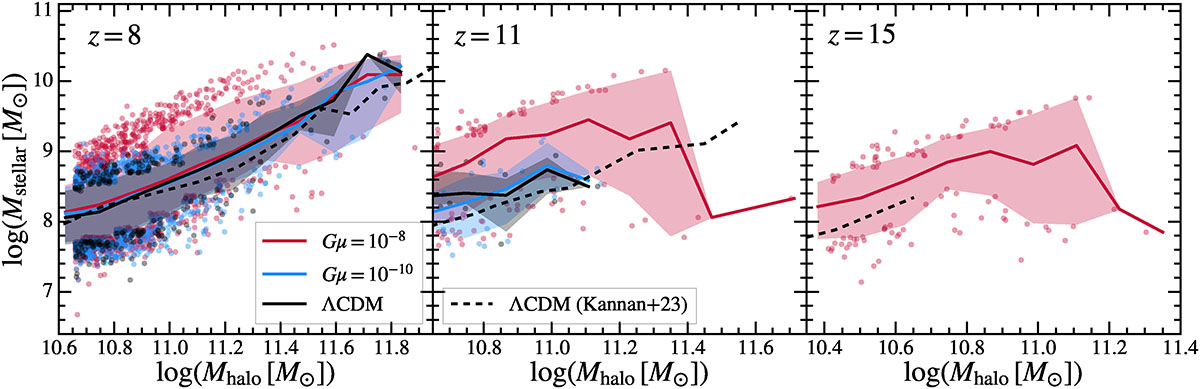
Fig. 4.
Download original image
Stellar-to-halo mass ratio of individual simulated galaxies (shaded circles) and median stellar-to-halo mass relation (solid curves) with the 10th to 90th percentile of the distribution (shaded error bands) for our ΛCDM (black), string tension Gμ = 10−8 (red), and Gμ = 10−10 (blue) runs. Shaded circles are only shown for the galaxies outside each mass bin’s shaded error bands to improve readability of the figure. We note that the plots include galaxies from all three separate simulations for each of the string tension values and the single baseline ΛCDM run (cf., Table 1 and Sect. 2). Therefore, the absolute number of Gμ = 10−8 and Gμ = 10−10 scatter points is increased by a factor of three relative to the number of ΛCDM points. We only include halos with masses in or above the first 80% complete halo mass bin (see text for details). Dashed black curves show the stellar-to-halo mass relation from K23 as a further ΛCDM reference.
Current usage metrics show cumulative count of Article Views (full-text article views including HTML views, PDF and ePub downloads, according to the available data) and Abstracts Views on Vision4Press platform.
Data correspond to usage on the plateform after 2015. The current usage metrics is available 48-96 hours after online publication and is updated daily on week days.
Initial download of the metrics may take a while.