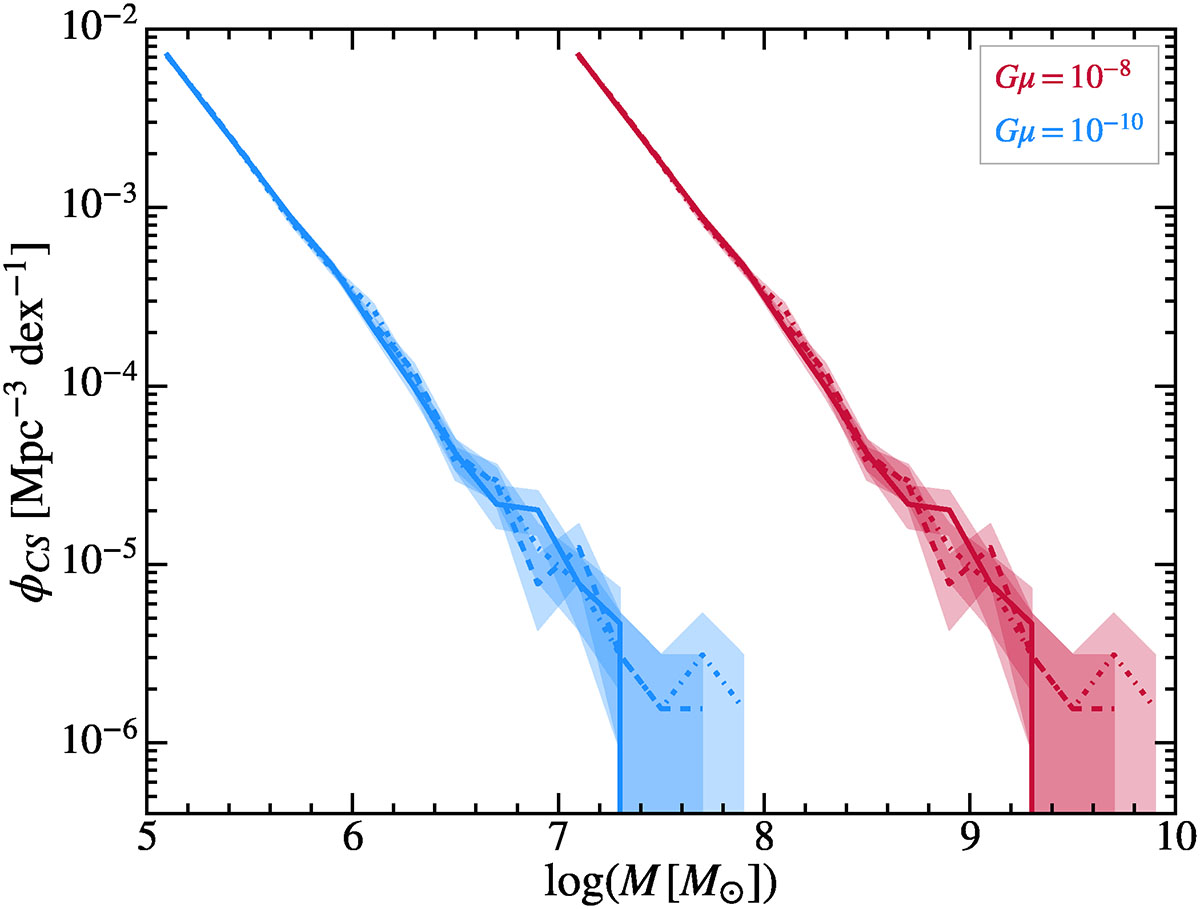
Fig. A.1.
Download original image
Mass functions of the different distributions of cosmic string loops used in this work. Solid, dashed, and dash-dotted red curves show the mass functions of loops used in our three string tension Gμ = 10−8 (CS-8) simulations. Blue curves show the same for our Gμ = 10−10 (CS-10) runs; the distributions are identical to the Gμ = 10−8 loops, with masses scaled down by a factor of 1/100 (see Sect. 2.1). Poisson errors are shown as shaded error bands in the corresponding colors.
Current usage metrics show cumulative count of Article Views (full-text article views including HTML views, PDF and ePub downloads, according to the available data) and Abstracts Views on Vision4Press platform.
Data correspond to usage on the plateform after 2015. The current usage metrics is available 48-96 hours after online publication and is updated daily on week days.
Initial download of the metrics may take a while.