Fig. B.2.
Download original image
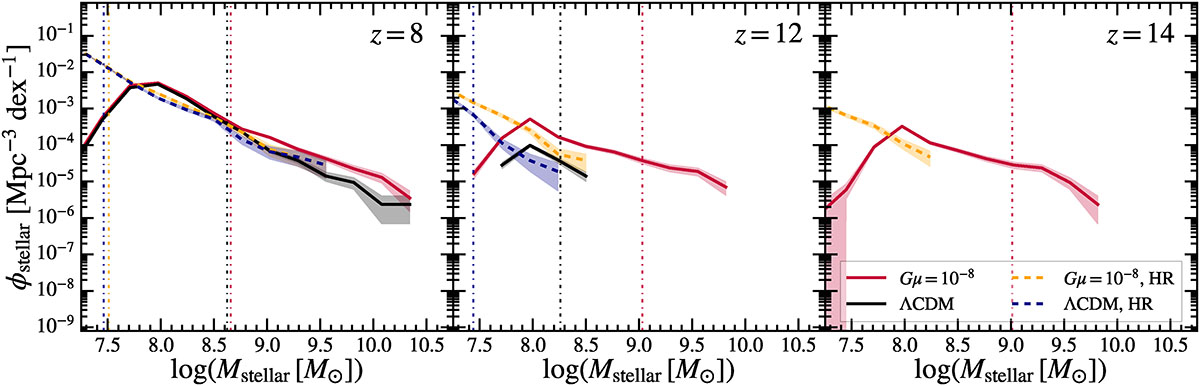
Comparison of stellar mass functions from our original ΛCDM (solid black curves) and Gμ = 10−8 (solid red curves) runs to those inferred from higher-resolution (HR) test runs with Poisson errors (shaded error bands) at redshifts z = 8, 12, and 14. Vertical dash-dotted lines in the corresponding colors indicate the median stellar mass in the first 95% complete halo mass bin (see Sect. 3.1 for details; cf. Fig. 2).
Current usage metrics show cumulative count of Article Views (full-text article views including HTML views, PDF and ePub downloads, according to the available data) and Abstracts Views on Vision4Press platform.
Data correspond to usage on the plateform after 2015. The current usage metrics is available 48-96 hours after online publication and is updated daily on week days.
Initial download of the metrics may take a while.