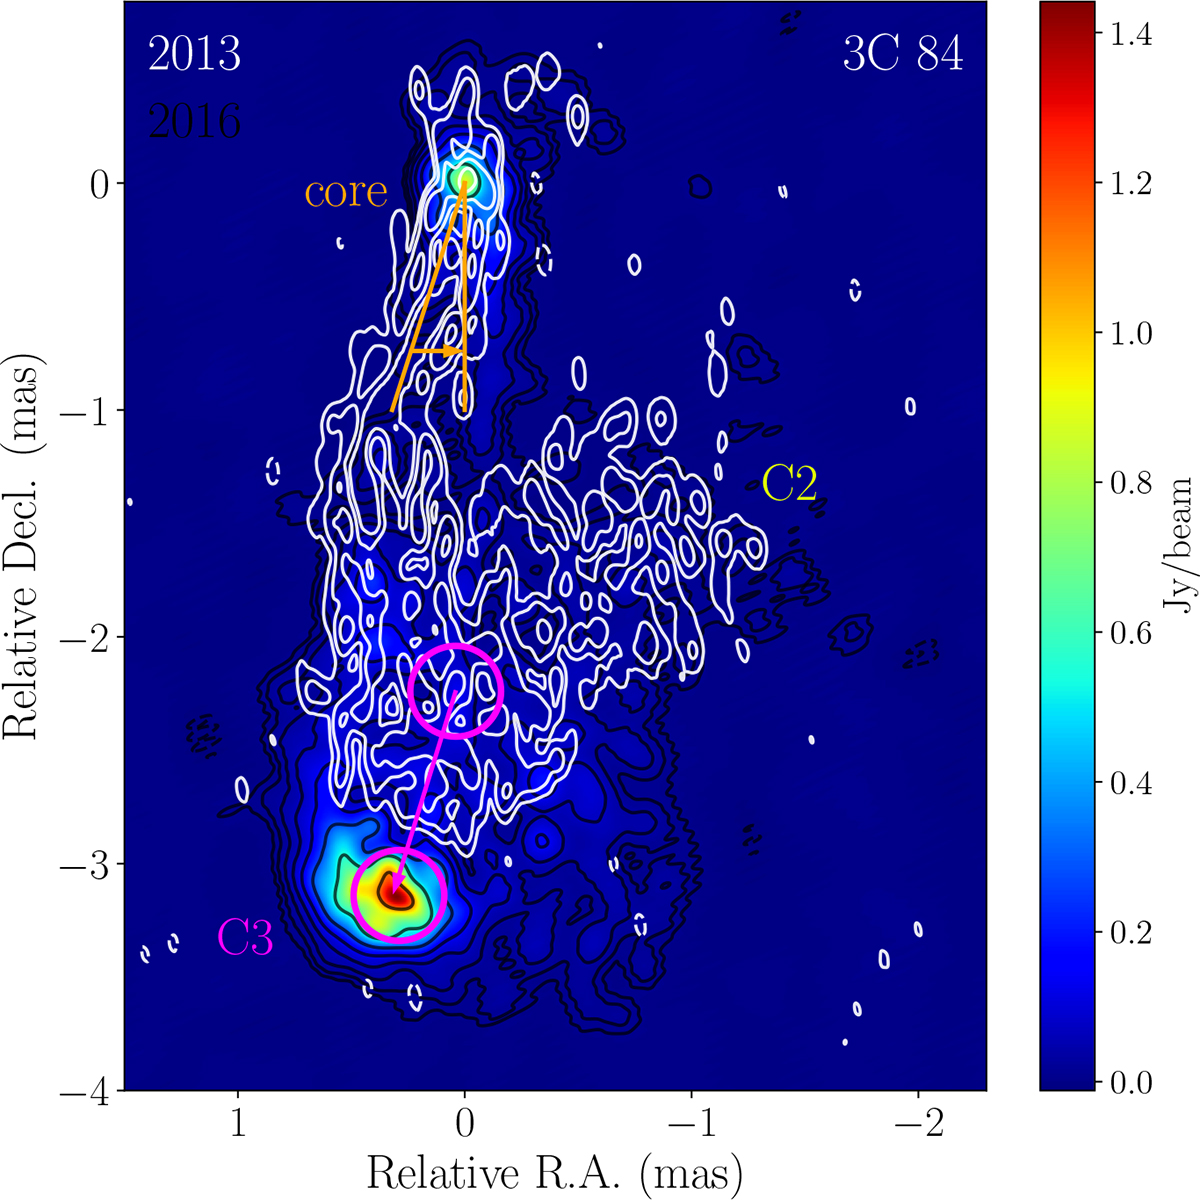
Fig. 3.
Download original image
RadioAstron images of 3C 84 from 2013 (white contours) and 2016 (color map and black contours). The core was shifted to the map center based on the values shown in Table C.2. Black contours are the same as in Fig. 1 panel b, and white contours start from 0.75 Jy/beam and increase by a factor of four. Magenta circles mark the change in the hotspot (C3) position between the two epochs, and orange lines indicate the 32 ± 1° change in the jet position angle.
Current usage metrics show cumulative count of Article Views (full-text article views including HTML views, PDF and ePub downloads, according to the available data) and Abstracts Views on Vision4Press platform.
Data correspond to usage on the plateform after 2015. The current usage metrics is available 48-96 hours after online publication and is updated daily on week days.
Initial download of the metrics may take a while.