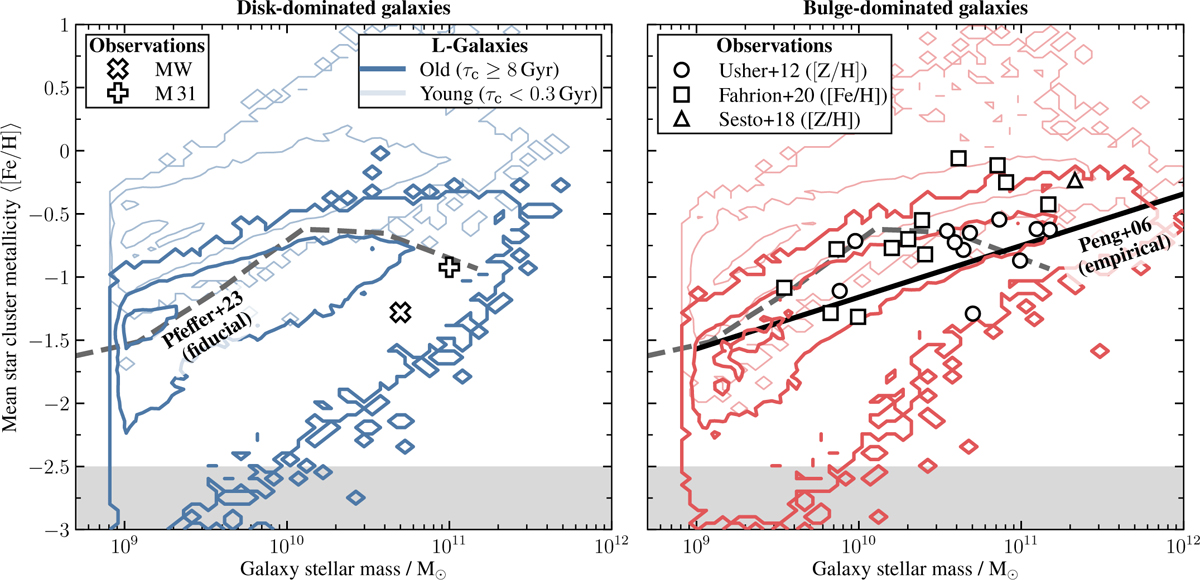
Fig. 8
Download original image
Mean star cluster metallicity per galaxy versus host galaxy stellar mass, separated into disk- (left panel) and bulge-dominated (right panel) galaxies. Strong (faint) contours give the 1, 2, and 3σ distribution for old (young) star clusters. The dashed grey line gives the fiducial model of Pfeffer et al. (2023), which assumes, similar to our model, an environmentally dependent prescription for the upper truncation mass of the CIMF and the cluster formation efficiency. The solid black line gives the empirical relationship for ellipticals in the nearby Virgo galaxy cluster (Peng et al. 2006). Data for the Milky Way and M 31 stem from a self-compiled data table that will be presented in future work. Other data points come from Usher et al. (2012), Sesto et al. (2018), and Fahrion et al. (2020). The grey shaded area marks the ‘lower-limit floor’ at ⟨[Fe/H]⟩ = −2.5 of observed star cluster metallicities in other galaxies (e.g. Beasley et al. 2019).
Current usage metrics show cumulative count of Article Views (full-text article views including HTML views, PDF and ePub downloads, according to the available data) and Abstracts Views on Vision4Press platform.
Data correspond to usage on the plateform after 2015. The current usage metrics is available 48-96 hours after online publication and is updated daily on week days.
Initial download of the metrics may take a while.