Fig. 14
Download original image
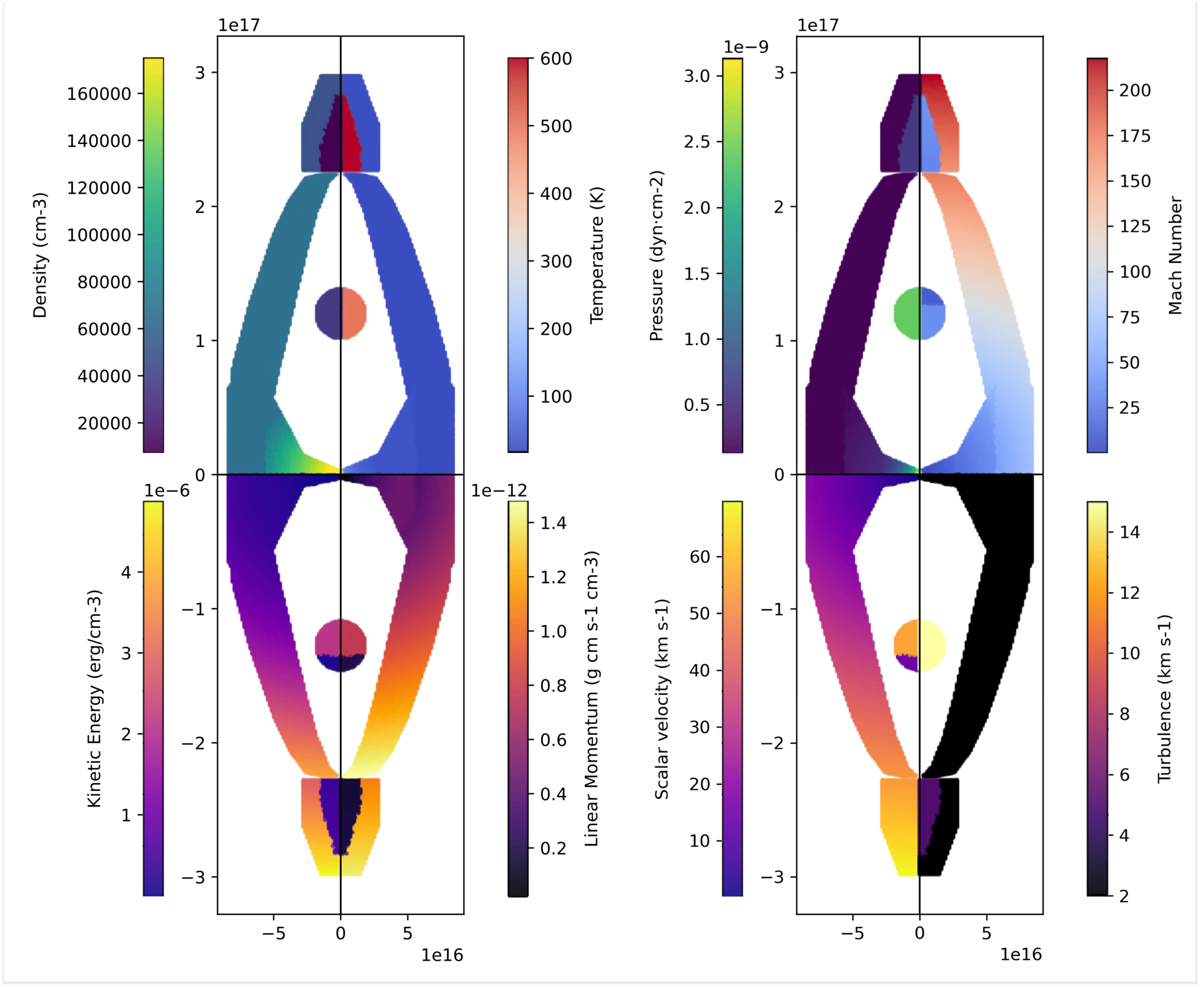
Distribution across the nebula of different physical values. In the left figure, the temperature (top right), density (top left), density of scalar linear momentum (bottom right), and density of kinetic energy (bottom left) are shown. In the right figure, the pressure (top left), Mach number (top right), scalar velocity (bottom left), and turbulence (bottom right) are shown. The axes are given in physical length units (centimetres). Note that 3.6×1016 cm subtends 1″.0 at the assumed distance of 2500 pc.
Current usage metrics show cumulative count of Article Views (full-text article views including HTML views, PDF and ePub downloads, according to the available data) and Abstracts Views on Vision4Press platform.
Data correspond to usage on the plateform after 2015. The current usage metrics is available 48-96 hours after online publication and is updated daily on week days.
Initial download of the metrics may take a while.