Fig. B.6
Download original image
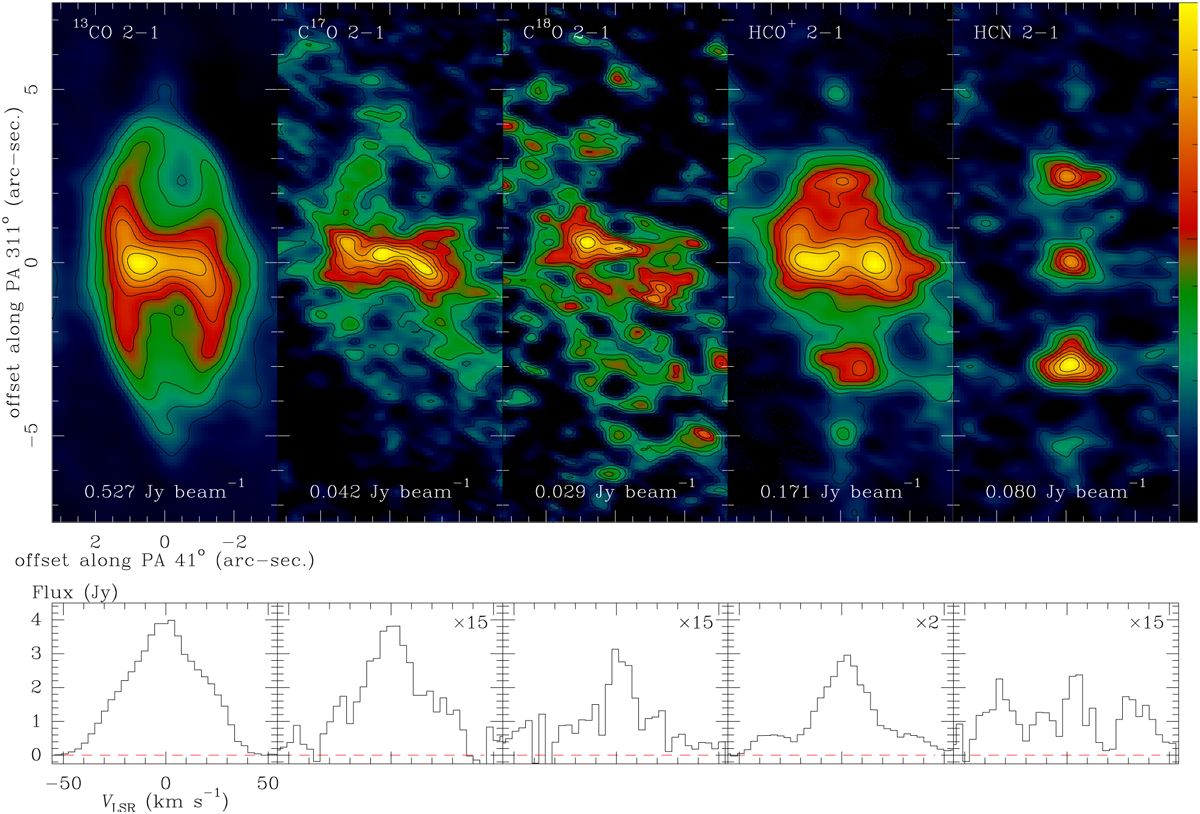
Moment zero maps (top panels) and integrated emission profiles (bottom panels) for the lines observed with the NOEMA interferometer: from left to right, 13CO J=2-1, C17O J=2-1, C18O J=2-1, HCO+ J=2-1, and HCN J=2-1. For the moment zero maps, the intensity is given in Jy beam−1. Contours are drawn at 10% to 90% by intervals of 10% of the maximum in the respective map. The contour step, 10% of maximum, in Jy beam−1, is given at the bottom of the panel. The colour scale is fixed between −10% and 100% of the maximum emission. Offsets are given along the major symmetry axis of the nebula (the maps have been rotated by 49° so the revolution axis of the nebula, at PA 311° is in the vertical direction). Integrated emission profile fluxes are given in Jy vs. LSR velocities in km s−1. To keep the same flux scale in all five panels, spectra other than that of 13CO J=2-1 have been multiplied by the factor indicated in the top right corner.
Current usage metrics show cumulative count of Article Views (full-text article views including HTML views, PDF and ePub downloads, according to the available data) and Abstracts Views on Vision4Press platform.
Data correspond to usage on the plateform after 2015. The current usage metrics is available 48-96 hours after online publication and is updated daily on week days.
Initial download of the metrics may take a while.