Open Access
Fig. 5
Download original image
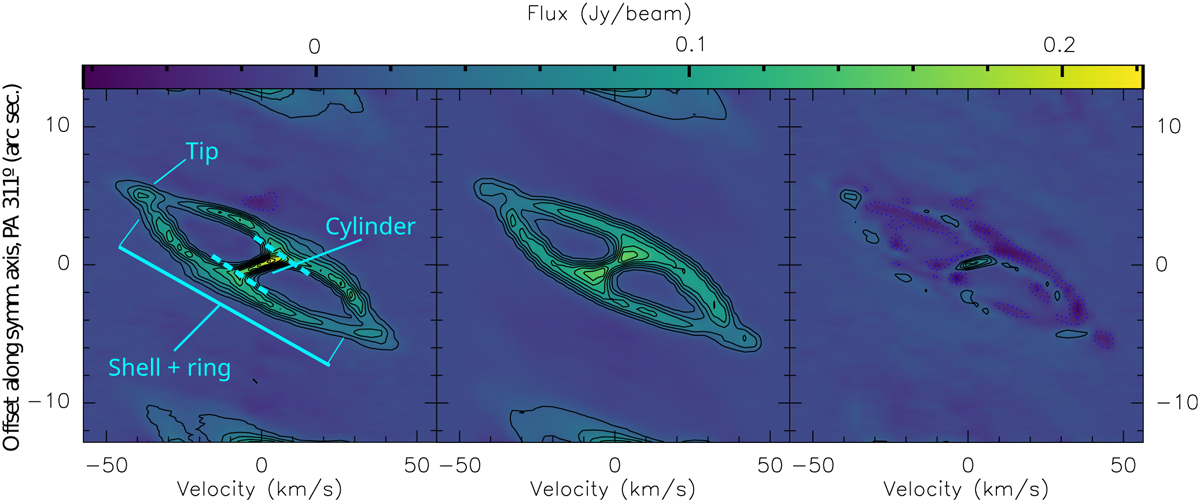
Position-velocity diagrams of observational data from IRAM-NOEMA (left), the model (centre), and residuals (observation - model; right) from the 13CO J=2-1 map. Contours are drawn at 20 mJy beam−1 intervals. The structures that dominate the emission are annotated in the observational data panel.
Current usage metrics show cumulative count of Article Views (full-text article views including HTML views, PDF and ePub downloads, according to the available data) and Abstracts Views on Vision4Press platform.
Data correspond to usage on the plateform after 2015. The current usage metrics is available 48-96 hours after online publication and is updated daily on week days.
Initial download of the metrics may take a while.