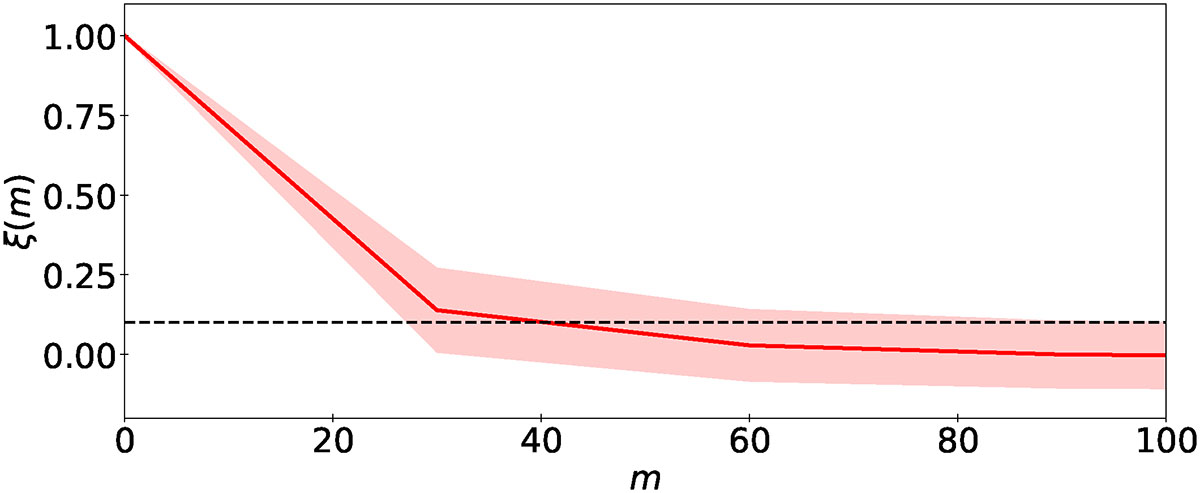
Fig. 3.
Download original image
TEST1: Mean auto-correlation ξ(n) as a function of lag, n, for a chain of length of M ≈ 1000, evaluated over 104 randomly selected voxels. The red curve shows the ensemble average, ⟨ξ(n)⟩, across parameters, with the shaded band indicating the ±1σ dispersion. The horizontal dashed line marks the threshold, ξ = 0.1, used to assess mixing efficiency.
Current usage metrics show cumulative count of Article Views (full-text article views including HTML views, PDF and ePub downloads, according to the available data) and Abstracts Views on Vision4Press platform.
Data correspond to usage on the plateform after 2015. The current usage metrics is available 48-96 hours after online publication and is updated daily on week days.
Initial download of the metrics may take a while.