Open Access
Fig. 5.
Download original image
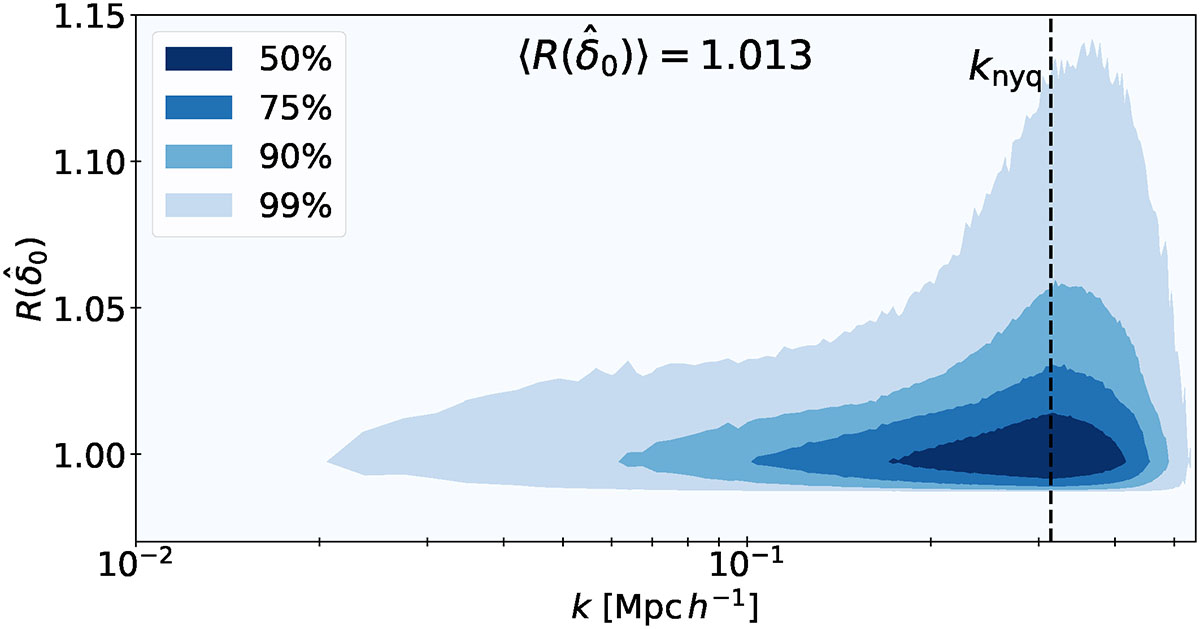
Gelman–Rubin convergence diagnostic computed for three independently initialised chains of 250 samples after convergence. This statistic is calculated for all cells in Fourier space, and we show their distribution with scale, k. Values close to one indicate that the drawn samples have converged to the same distribution.
Current usage metrics show cumulative count of Article Views (full-text article views including HTML views, PDF and ePub downloads, according to the available data) and Abstracts Views on Vision4Press platform.
Data correspond to usage on the plateform after 2015. The current usage metrics is available 48-96 hours after online publication and is updated daily on week days.
Initial download of the metrics may take a while.