Fig. 7.
Download original image
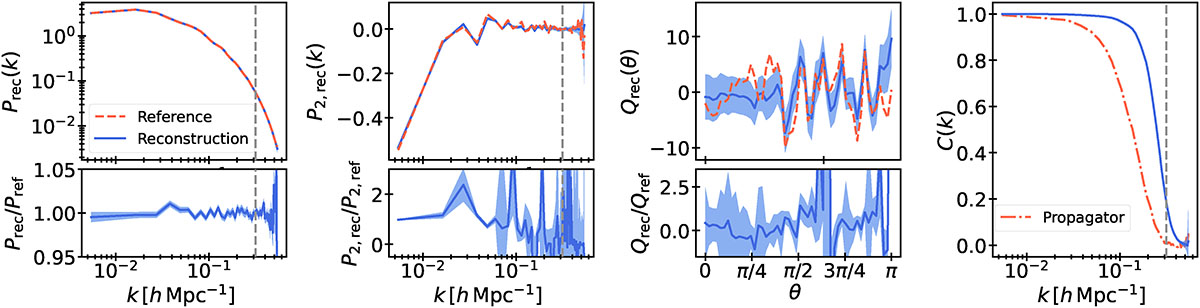
TEST1: Comparison of summary statistics of the initial density contrast field for the mock reference (dashed red line) and 500 independent reconstructions (solid blue line). Columns from left to right: (1) Monopole power spectrum; (2) quadrupole; (3) reduced bispectrum as a function of triangle opening angle, θ; and (4) cross-correlation coefficient C(k) between the reference and reconstruction (solid blue line) and the propagator (dashed red line), defined as the cross-correlation between the mock tracer density contrast and the initial density reference. In columns (1)–(3), the lower sub-panels display the ratios with respect to the reference. Shaded bands denote the 1σ intervals from the posterior samples. Vertical dashed lines indicate the isotropic Nyquist frequency, ![]() .
.
Current usage metrics show cumulative count of Article Views (full-text article views including HTML views, PDF and ePub downloads, according to the available data) and Abstracts Views on Vision4Press platform.
Data correspond to usage on the plateform after 2015. The current usage metrics is available 48-96 hours after online publication and is updated daily on week days.
Initial download of the metrics may take a while.