Fig. 3
Download original image
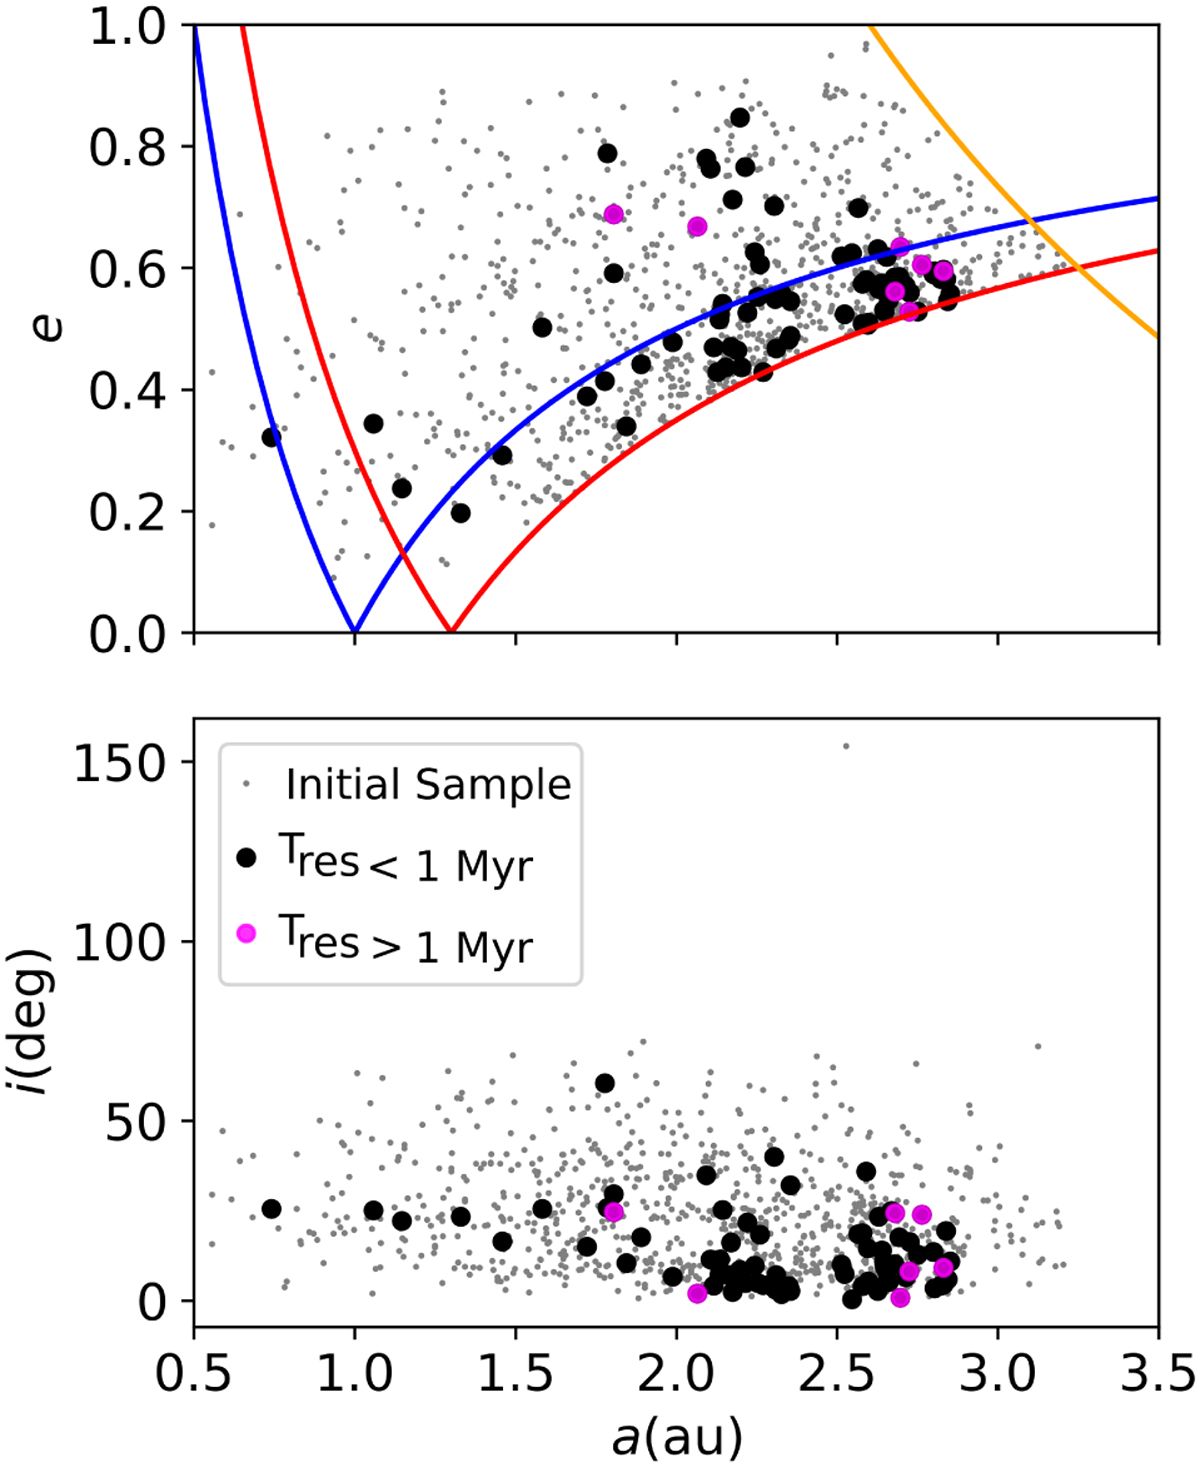
Initial orbital distribution of 76 large NEOs that reached the Centaur region in the a × e (top) and a × i (bottom) planes, shown relative to the whole initial sample of large NEOs (gray dots). Black and pink dots highlight the NEOs that survived as NEO-Centaurs for residence times Tres < 1 Myr and Tres > 1 Myr, respectively. Blue and red lines denote the apocenter and pericenter lies of Earth and Mars, and the orange line denotes the apocenter of Jupiter.
Current usage metrics show cumulative count of Article Views (full-text article views including HTML views, PDF and ePub downloads, according to the available data) and Abstracts Views on Vision4Press platform.
Data correspond to usage on the plateform after 2015. The current usage metrics is available 48-96 hours after online publication and is updated daily on week days.
Initial download of the metrics may take a while.