Fig. 4
Download original image
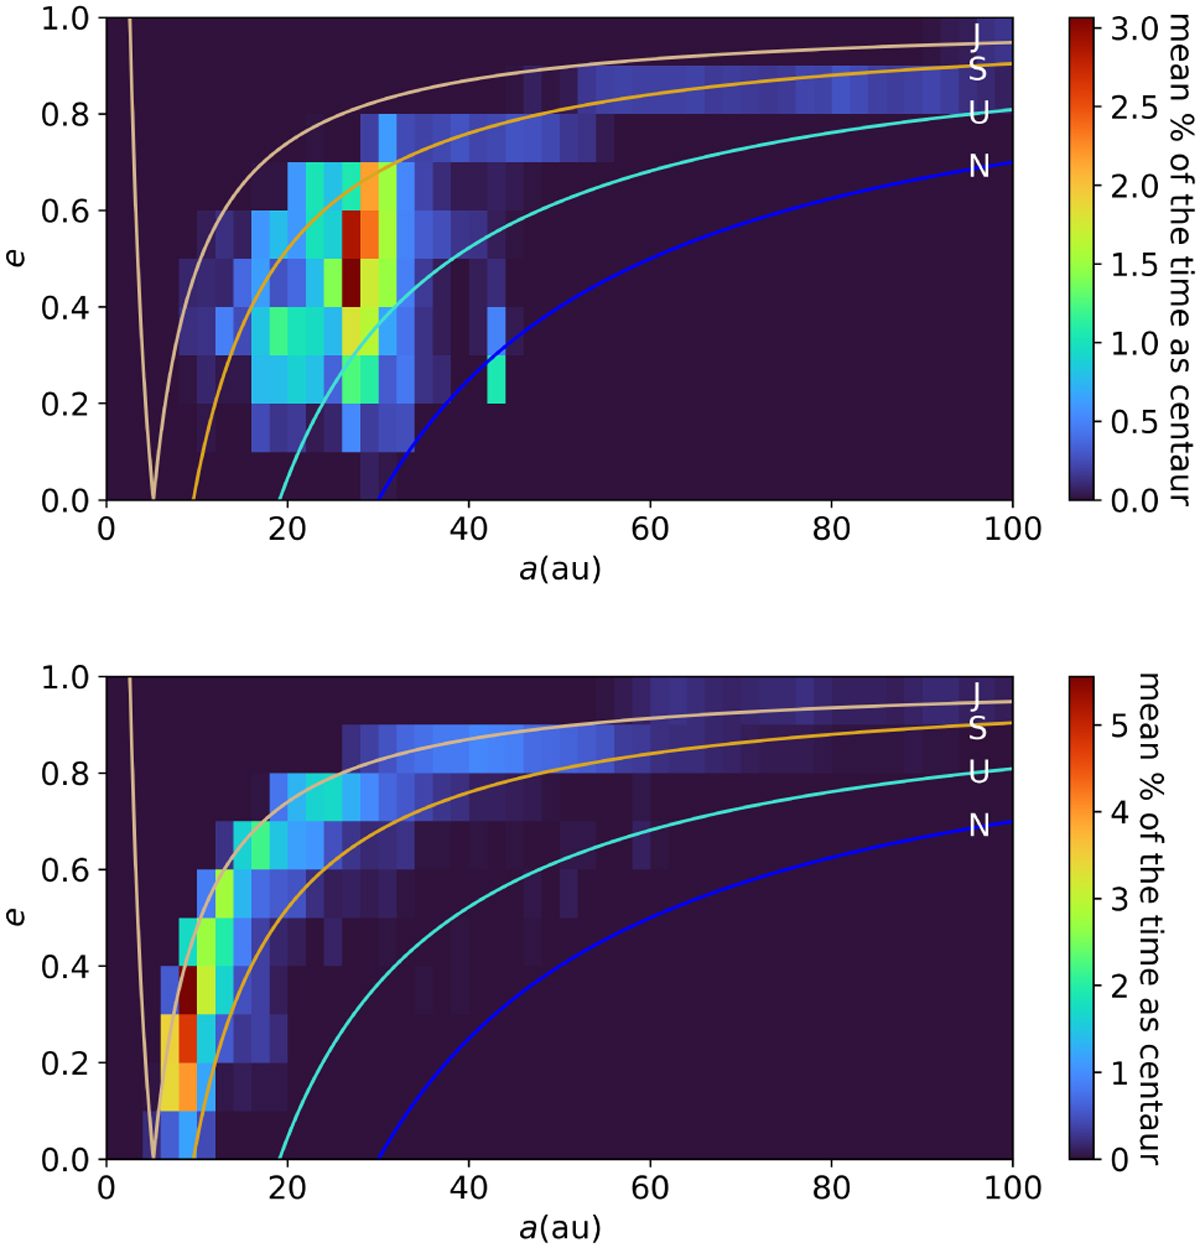
Residence region for seven long-lived NEO-Centaurs (Tres > 1 Myr) (top) and sixty-nine short-lived NEO-Centaurs (Tres < 1 Myr) (bottom). The colored lines delineate the pericenter crossings of the giant planets’ orbits: Jupiter, Saturn, Uranus, and Neptune. The color code on the right indicates the mean percentage of time spent as a Centaur relative to the total lifetime of each subgroup in the (a × e) grid with ∆a = 2 au and ∆e = 0.1.
Current usage metrics show cumulative count of Article Views (full-text article views including HTML views, PDF and ePub downloads, according to the available data) and Abstracts Views on Vision4Press platform.
Data correspond to usage on the plateform after 2015. The current usage metrics is available 48-96 hours after online publication and is updated daily on week days.
Initial download of the metrics may take a while.