Open Access
Fig. 5
Download original image
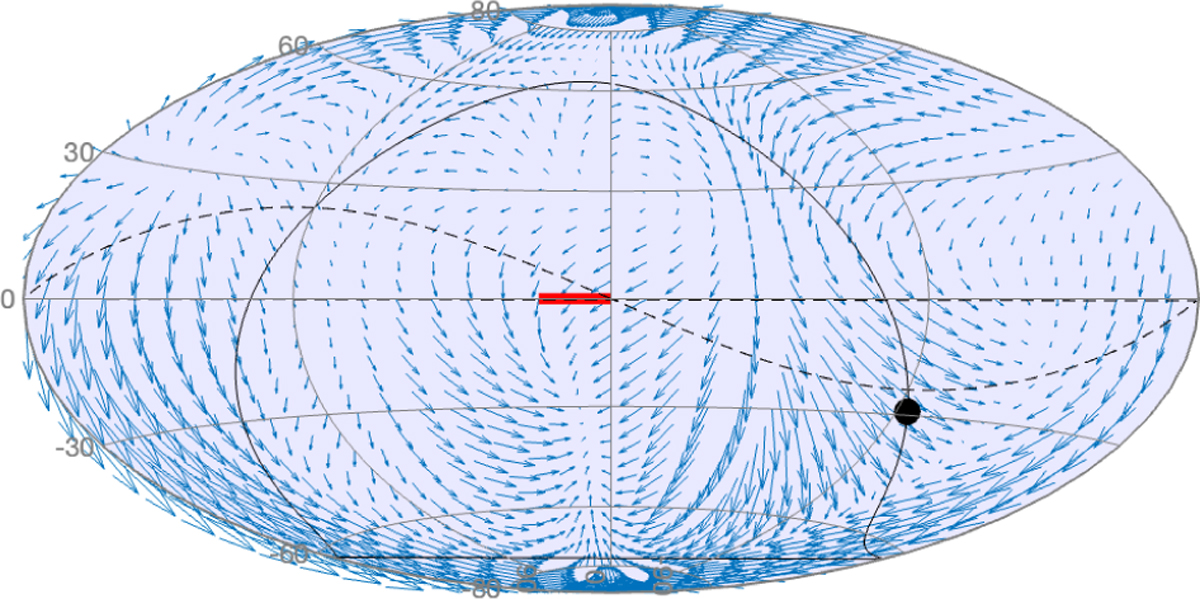
Vector field of the systematic errors between COMB2X and ICRF3X, excluding harmonics T10 and T11 (rotations). The bold red line at the center represents an amplitude of 50 μas. The black curve is the Galactic equator. The black disk is the Galactic center. The dashed curve is the ecliptic.
Current usage metrics show cumulative count of Article Views (full-text article views including HTML views, PDF and ePub downloads, according to the available data) and Abstracts Views on Vision4Press platform.
Data correspond to usage on the plateform after 2015. The current usage metrics is available 48-96 hours after online publication and is updated daily on week days.
Initial download of the metrics may take a while.