Fig. 2.
Download original image
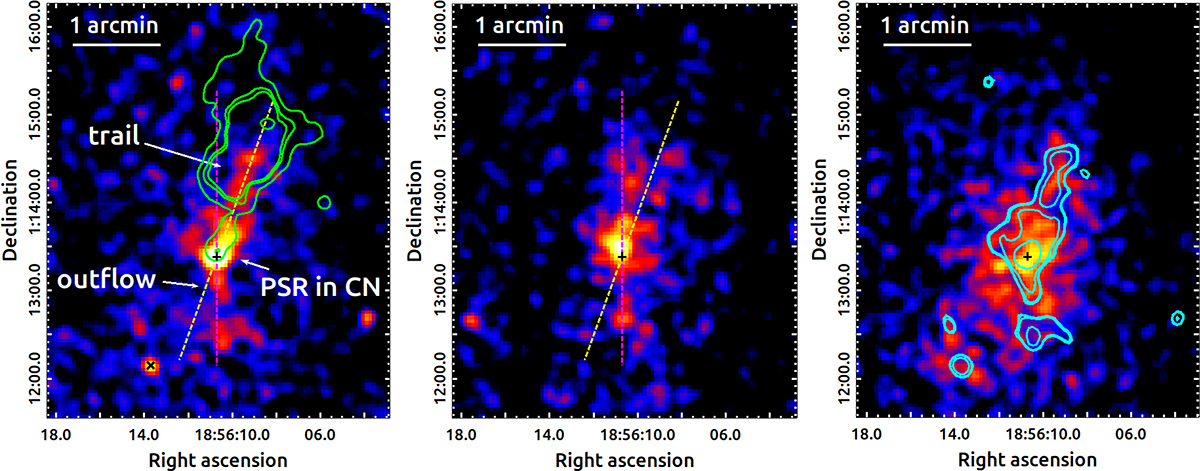
Images of PSR B1853+01 (position marked by a black cross) and its surrounding emission. Left: Exposure-corrected merged Chandra ACIS image in the 4–8 keV energy band, created by combining all three archived observations. The green contours show the radio emission from the PWN (radio FITS file obtained from SNRC at http://snrcat.physics.umanitoba.ca/SNRrecord.php?id=G034.7m00.4). The image is binned by a factor five (pixel size = 2.46″). The dashed yellow line shows the approximate symmetry axis of the PWN tail, which can be divided into two subregions: a compact nebula (CN) surrounding the pulsar and a trail emission further out. The dashed magenta line indicates the N-S direction which roughly coincides with the direction of the outflow just leaving the PWN bow shock. The position of a nearby source 2CXO J185613.6+011207 is marked by a black X. Middle: Merged (MOS1+MOS2) mosaic on-axis (Obs. 0551060101) XMM-Newton counts image in the 4–8 keV energy band (pixel size = 2.5″). Right: Merged (FPMA+FPMB) mosaic NuSTAR image in the 4–10 keV band (pixel size = 2.46″), together with the contour map (in cyan) extracted from the Chandra image shown in the left panel. All images were smoothed with a Gaussian kernel of r = 3 pixels and σ = 1.5 pixels.
Current usage metrics show cumulative count of Article Views (full-text article views including HTML views, PDF and ePub downloads, according to the available data) and Abstracts Views on Vision4Press platform.
Data correspond to usage on the plateform after 2015. The current usage metrics is available 48-96 hours after online publication and is updated daily on week days.
Initial download of the metrics may take a while.