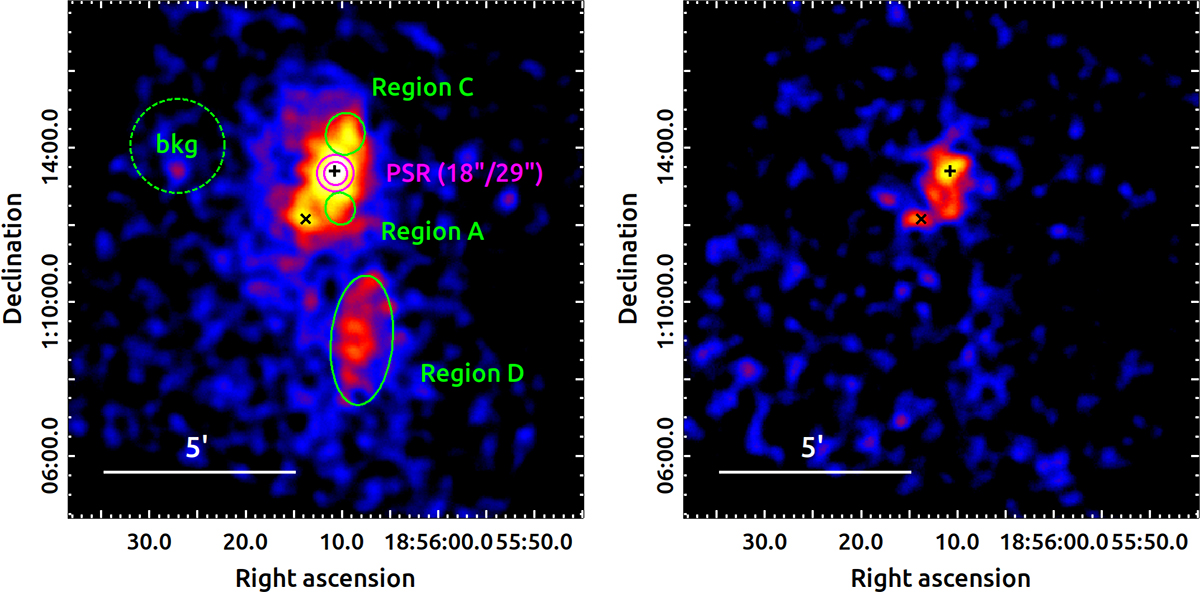
Fig. 3.
Download original image
Merged (FPMA+FPMB) NuSTAR images obtained in increasing energy bands. Images are smoothed with a Gaussian kernel of r = 8 pixels and σ = 4 pixels. The position of PSR B1853+01 is marked by a black cross, while the position of a nearby source, 2CXO J185613.6+011207, is marked by a black X. Left: 4.0–10.0 keV image shows an extended emission that coincides with the position of PSR B1853+01, exhibiting a spindle-like shape tapering at both ends and a faint extended emission in the south. Regions used for spatially resolved spectral analysis are shown here. Pulsar spectra were extracted using the magenta circles of two different radii 18″/29″. Region A is similar to the outflow region, Region C is similar to the trail region and Region D is similar to part of the southern halo where one of the large antenna feature lies. The background region is shown by dashed green circle. Right: 10.0–20.0 keV image. The PSR+PWN system is detected up to energies of ∼20 keV.
Current usage metrics show cumulative count of Article Views (full-text article views including HTML views, PDF and ePub downloads, according to the available data) and Abstracts Views on Vision4Press platform.
Data correspond to usage on the plateform after 2015. The current usage metrics is available 48-96 hours after online publication and is updated daily on week days.
Initial download of the metrics may take a while.