Fig. 6.
Download original image
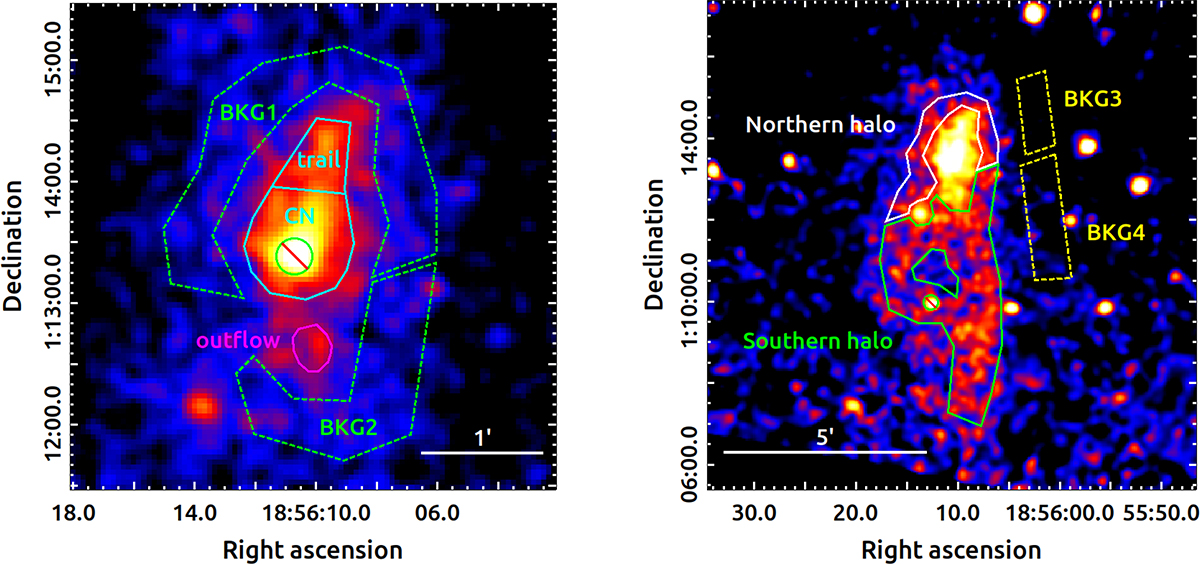
Left: 4′ × 4′ XMM-Newtonpn image in 4.0–8.0 keV band (merged from Obs. 0721630101, 0721630201, and 0721630301). The extraction regions for the tail region (solid cyan; crossed green circle region representing PSR B1853+01 was excluded from the CN/tail spectral analysis) and the outflow region (solid magenta) are shown. The tail region can be further split into two subregions: CN and trail (separated by the line). A background region inside the thermal X-ray emission area BKG1 (dashed green) was chosen for the tail regions while the outside BKG2 (dashed green) was chosen for the outflow. Right: 12′ × 12′ XMM-Newtonpn image in 4.0–8.0 keV band (merged from Obs. 0721630101, 0721630201, and 0721630301). The extraction regions for the halo region are shown. The halo region is divided into two subregions: the northern halo (solid white) and the southern halo (solid green). Background regions (dashed yellow lines) for these two regions of interest are BKG3 and BKG4, respectively. The point source (shown by the crossed green circle) that appears in the southern halo region was excluded from the halo spectral analysis.
Current usage metrics show cumulative count of Article Views (full-text article views including HTML views, PDF and ePub downloads, according to the available data) and Abstracts Views on Vision4Press platform.
Data correspond to usage on the plateform after 2015. The current usage metrics is available 48-96 hours after online publication and is updated daily on week days.
Initial download of the metrics may take a while.