Fig. 1.
Download original image
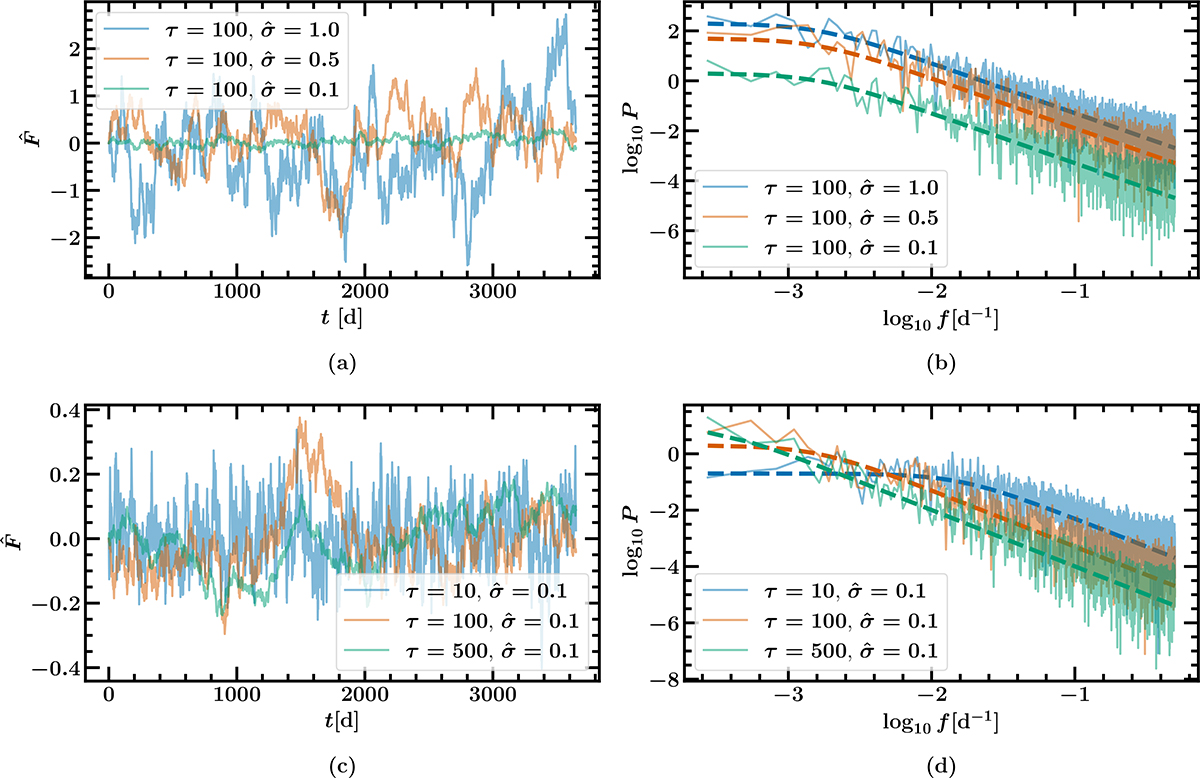
Examples of light curves generated using celerite varying the process parameters: damping timescale τ (panel a), and the variability amplitude ![]() (panel c). In the right panels, the retrieved periodograms (computed as discussed in Appendix A) as well as the theoretical expected PSD (dashed lines) are shown. The time series (
(panel c). In the right panels, the retrieved periodograms (computed as discussed in Appendix A) as well as the theoretical expected PSD (dashed lines) are shown. The time series (![]() ) are centred at zero and have arbitrary units. The parameter σ and power (P) should be considered in terms of the same dimensional scale as
) are centred at zero and have arbitrary units. The parameter σ and power (P) should be considered in terms of the same dimensional scale as ![]() , with P having units of the square of the units of
, with P having units of the square of the units of ![]() .
.
Current usage metrics show cumulative count of Article Views (full-text article views including HTML views, PDF and ePub downloads, according to the available data) and Abstracts Views on Vision4Press platform.
Data correspond to usage on the plateform after 2015. The current usage metrics is available 48-96 hours after online publication and is updated daily on week days.
Initial download of the metrics may take a while.