Fig. 4.
Download original image
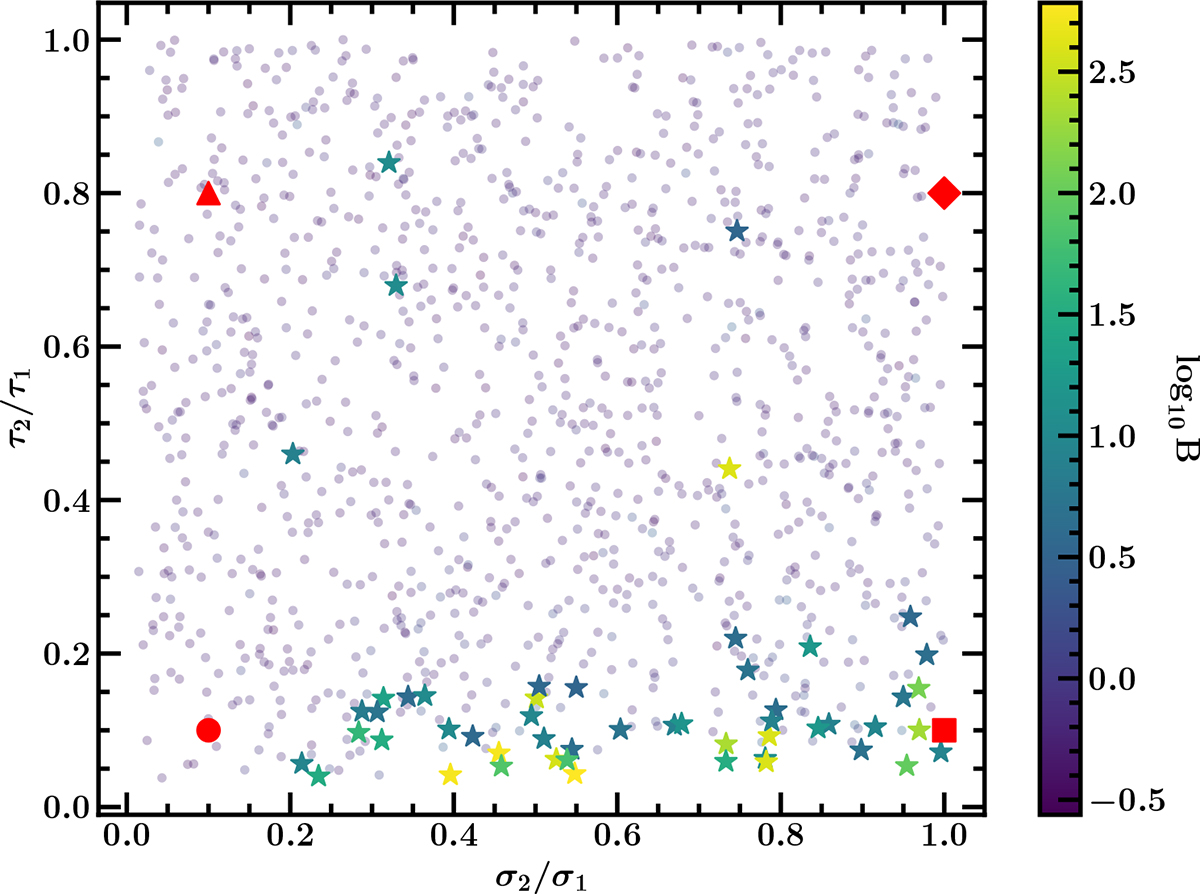
Map of Bayes factors for 1500 unevenly sampled realisations of UBHD light curves with a ten-year baseline. The colour scale represents the base-10 logarithm of the Bayes factor, while the axes show the ratio of the model parameters between the two light curves. The red square, diamond, triangle and circle correspond to the light curves used to compute the periodograms shown in panels a,b,c, and d, respectively, in Figures 6 and B.1.
Current usage metrics show cumulative count of Article Views (full-text article views including HTML views, PDF and ePub downloads, according to the available data) and Abstracts Views on Vision4Press platform.
Data correspond to usage on the plateform after 2015. The current usage metrics is available 48-96 hours after online publication and is updated daily on week days.
Initial download of the metrics may take a while.