Fig. 6.
Download original image
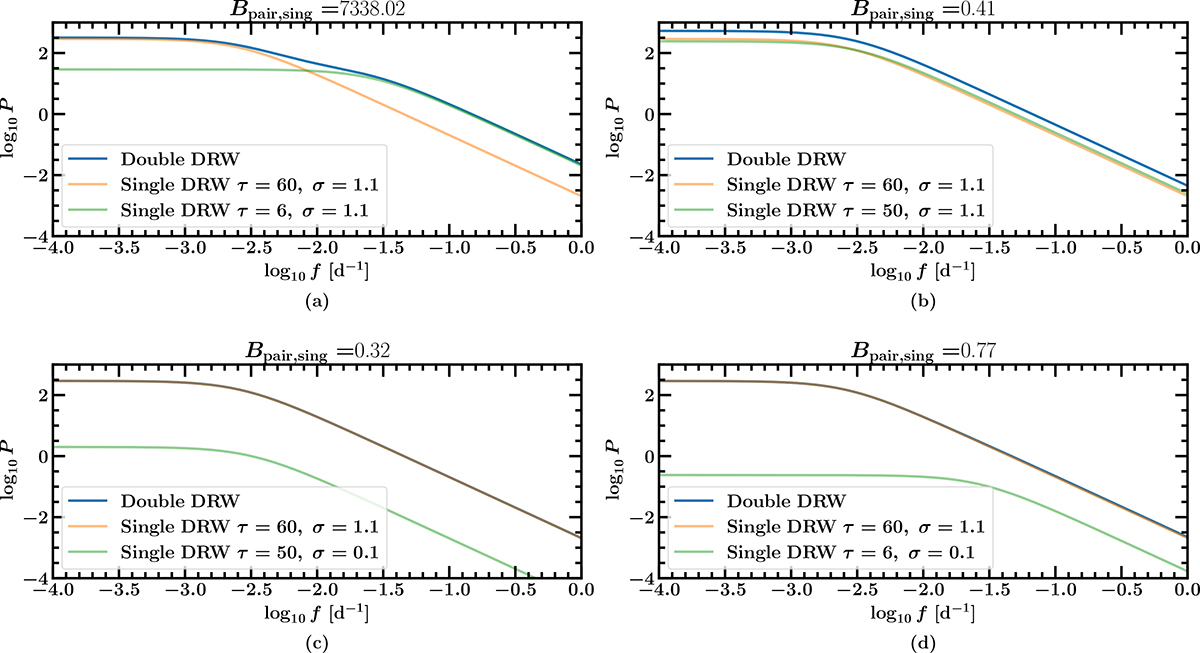
PSD of double DRW kernels for different parameter ratios. The Bayes ratio resulting from the GP fitting is reported above each panel. In all the panels, the light curves are sampled every 3 d for 10 yr. The power is reported in arbitrary units. Case (a): Similar variability amplitudes but considerably different damping timescales. The test can correctly identify the UBHD (shown as the red square in Figure 4). Case (b): Similar amplitudes and similar damping timescales (shown as the red diamond in Figure 4). Case (c): Considerably different amplitudes but similar damping timescales (shown as the red triangle in Figure 4). Case (d): Considerably different amplitudes and damping timescales (shown as the red circle in Figure 4).
Current usage metrics show cumulative count of Article Views (full-text article views including HTML views, PDF and ePub downloads, according to the available data) and Abstracts Views on Vision4Press platform.
Data correspond to usage on the plateform after 2015. The current usage metrics is available 48-96 hours after online publication and is updated daily on week days.
Initial download of the metrics may take a while.