Open Access
Fig. 7.
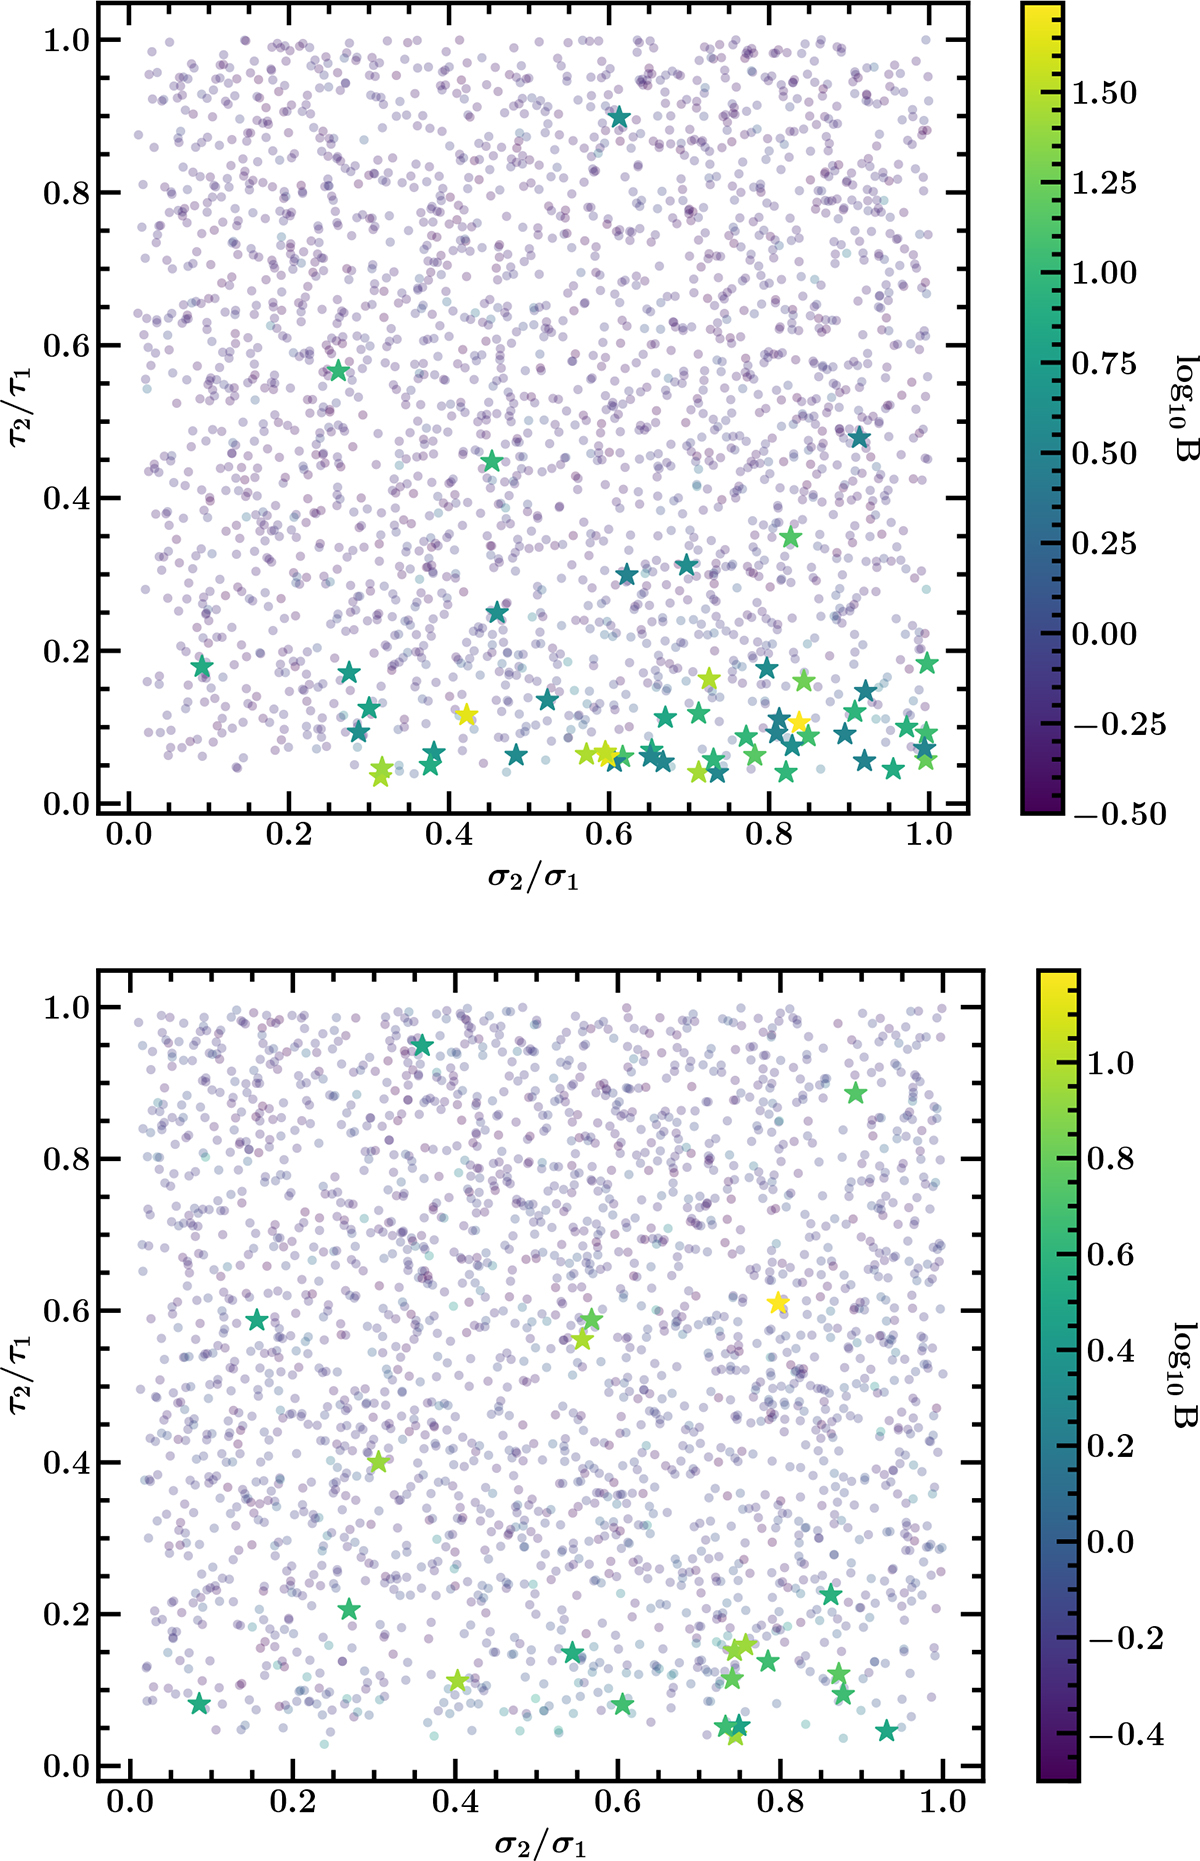
Download original image
Similar to the map in Figures 4 but with different observational baselines. In the upper panel, the light curves are observed for 6 years, while in the lower panel, the light curves are observed for 3 years.
Current usage metrics show cumulative count of Article Views (full-text article views including HTML views, PDF and ePub downloads, according to the available data) and Abstracts Views on Vision4Press platform.
Data correspond to usage on the plateform after 2015. The current usage metrics is available 48-96 hours after online publication and is updated daily on week days.
Initial download of the metrics may take a while.