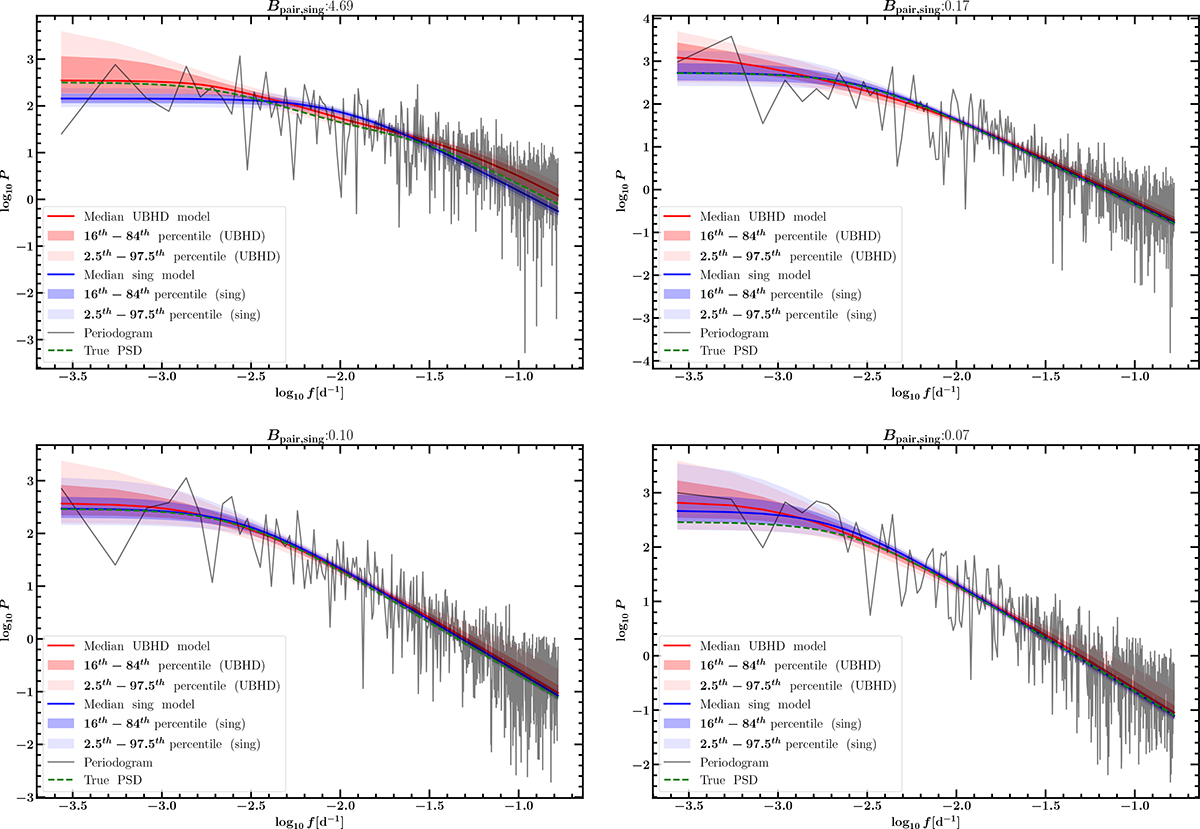
Fig. B.1.
Download original image
Results of the direct fit of the PSD for evenly sampled light curves with a 3 d cadence for 10 yr. The grey line indicates the light curve periodogram. The red and blue solid lines show the median model for the double and single DRW, respectively. The red and blue shaded areas show confidence intervals (16th − 84th and 2.5th − 97.5th ) for the UBHD and single DRW, respectively.
Current usage metrics show cumulative count of Article Views (full-text article views including HTML views, PDF and ePub downloads, according to the available data) and Abstracts Views on Vision4Press platform.
Data correspond to usage on the plateform after 2015. The current usage metrics is available 48-96 hours after online publication and is updated daily on week days.
Initial download of the metrics may take a while.