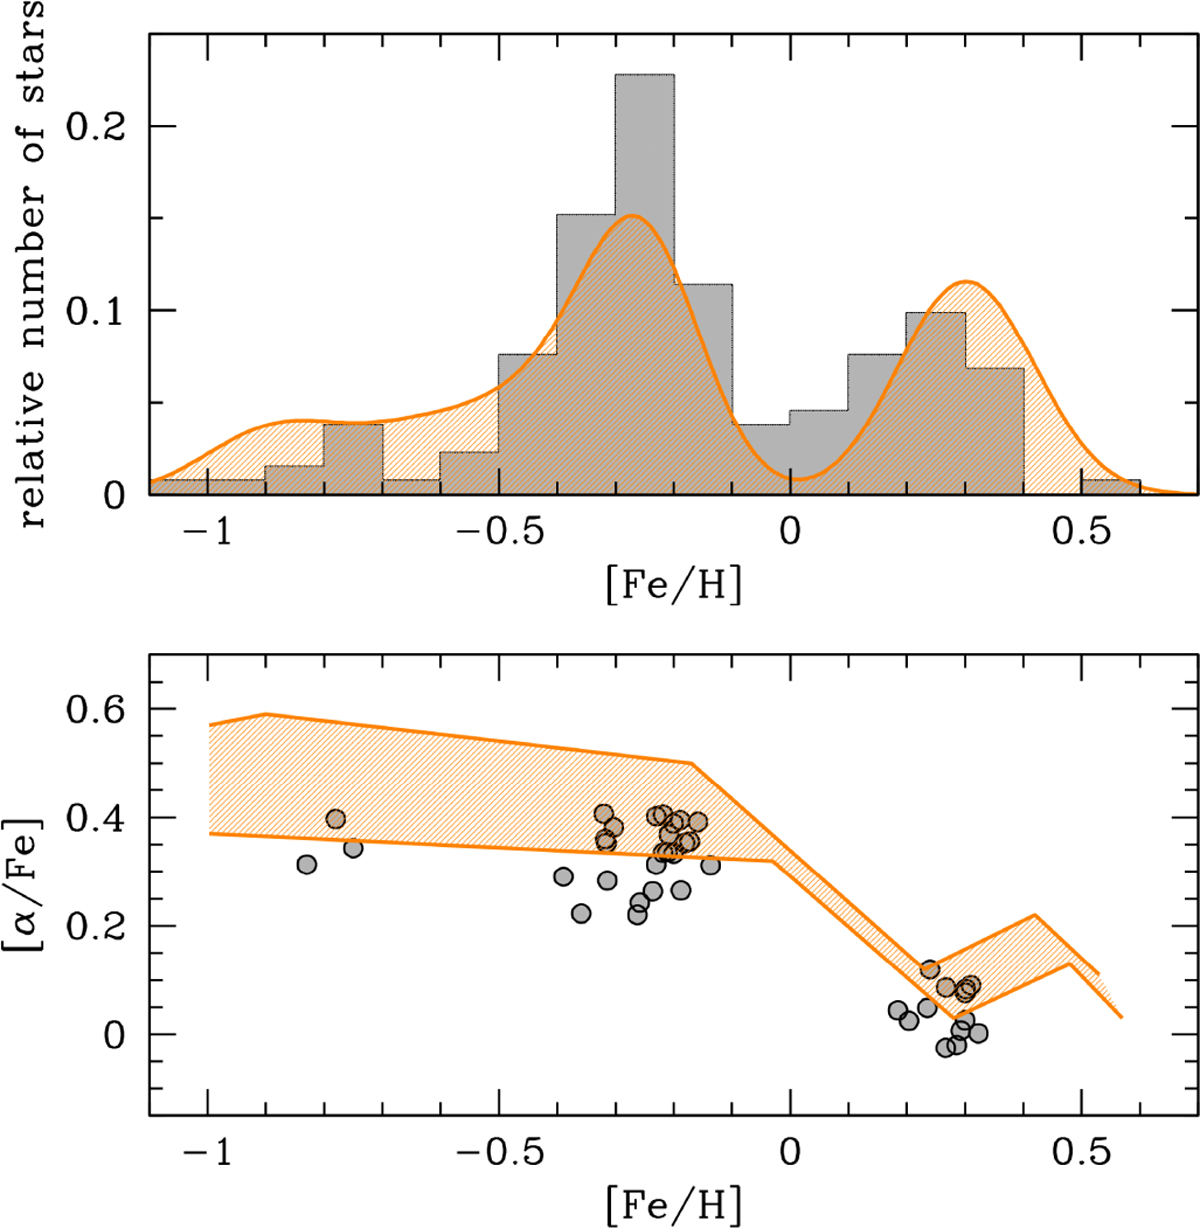
Fig. 1
Download original image
Top panel: observed iron distribution of Terzan 5 (gray histogram, from Massari et al. 2014) compared to the prediction of model S02s by Romano et al. (2023, orange shaded region). Bottom panel: [α/Fe]–[Fe/H] abundance pattern observed in Terzan 5 (gray circles, from Origlia et al. 2011, 2013, 2025) compared to the prediction of model S02s presented in Romano et al. (2023, orange shaded region). In both panels, the width of the shaded area represents the uncertainties related to different assumptions about the presence (lower curve) or the absence (upper curve) of hypernovae that, during the explosion, release energies one order of magnitude larger than those of normal core-collapse SNe.
Current usage metrics show cumulative count of Article Views (full-text article views including HTML views, PDF and ePub downloads, according to the available data) and Abstracts Views on Vision4Press platform.
Data correspond to usage on the plateform after 2015. The current usage metrics is available 48-96 hours after online publication and is updated daily on week days.
Initial download of the metrics may take a while.