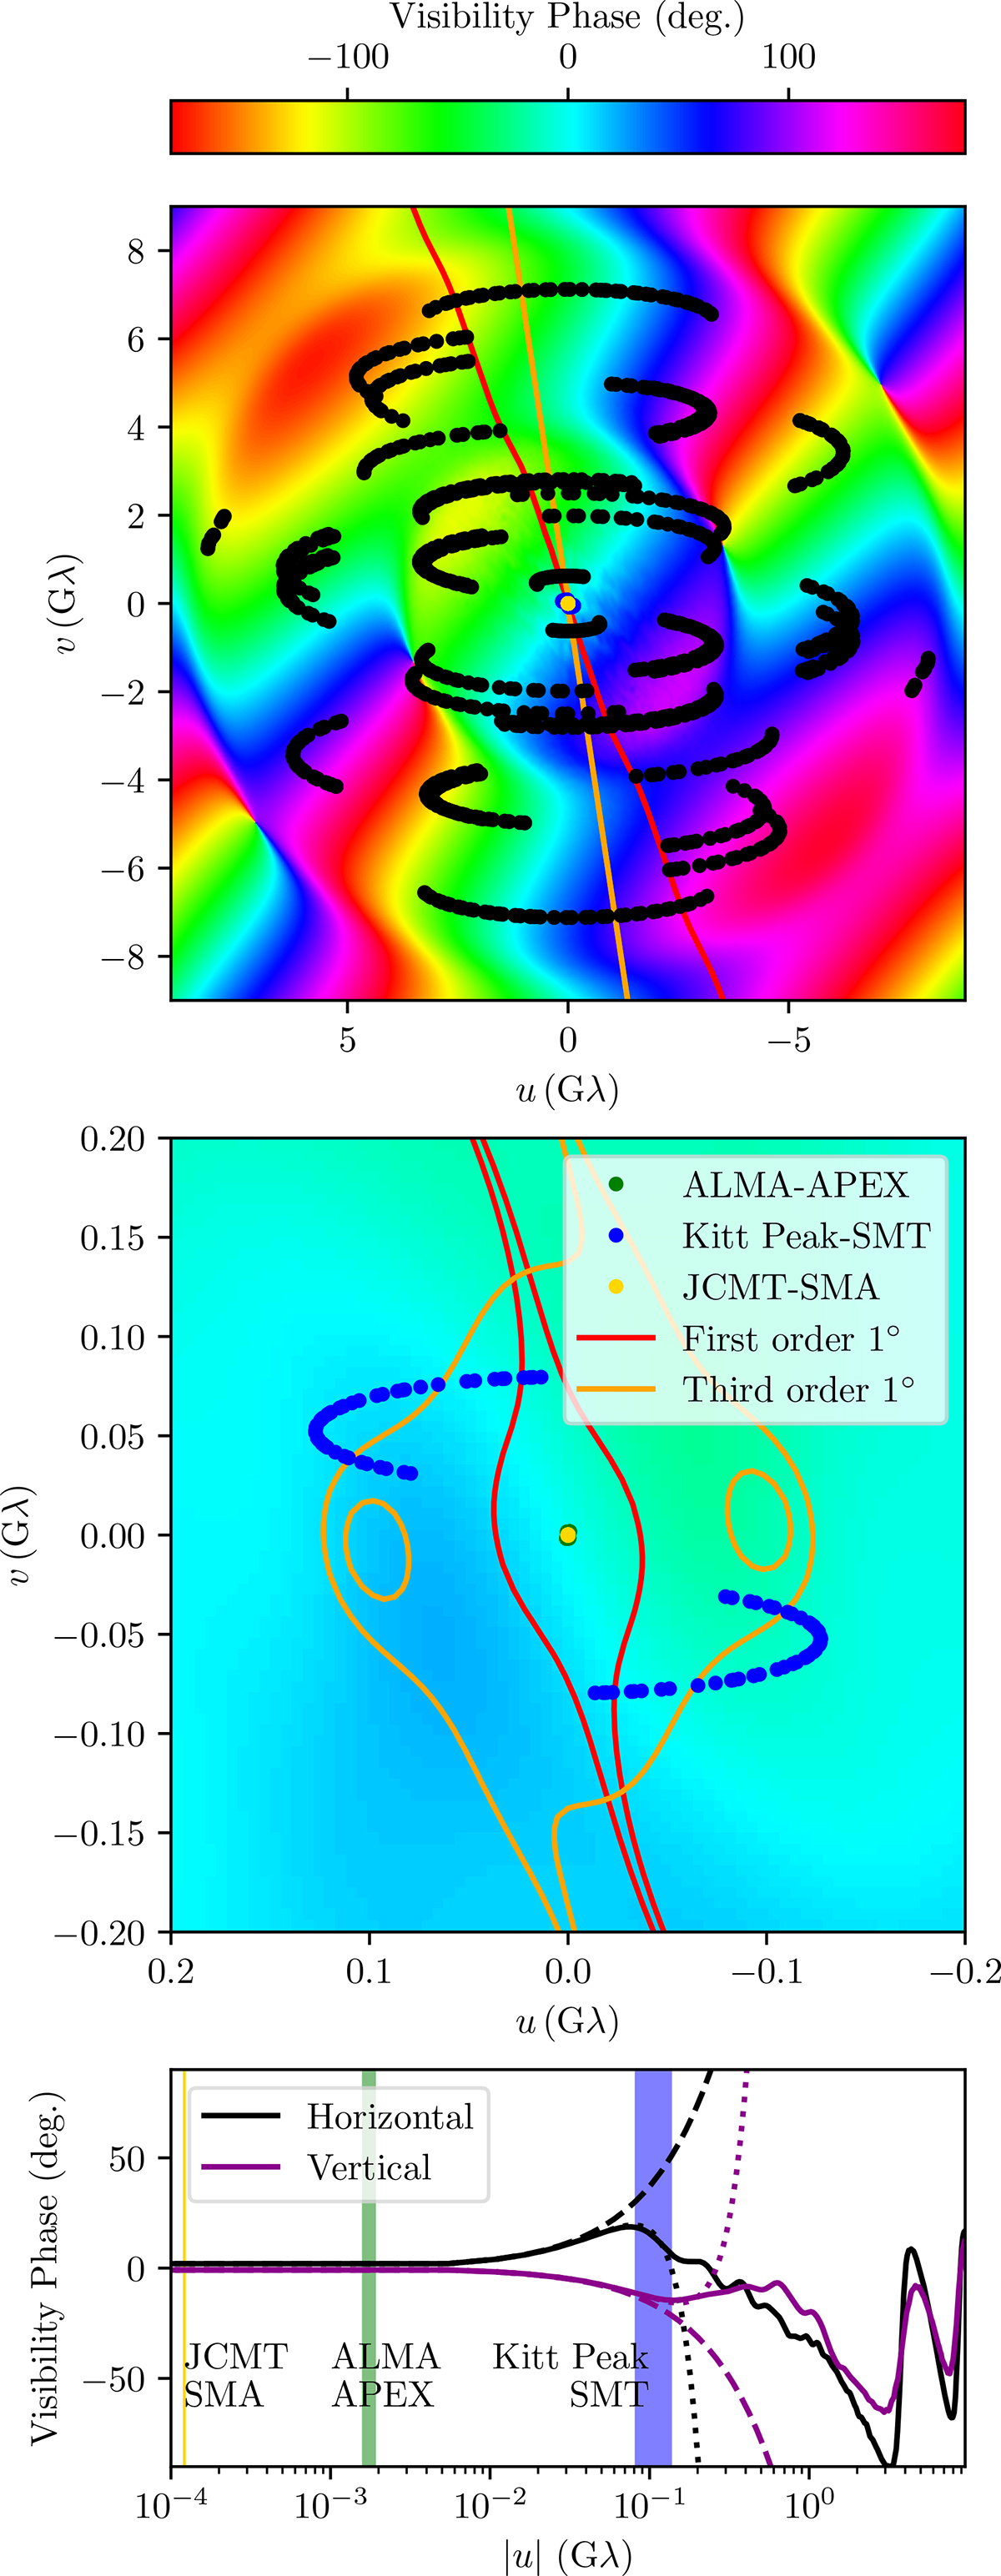
Fig. 2.
Download original image
Top and middle panels show the visibility phases for the source model in Figure 1. The middle panel is a zoomed in version of the top panel. Black points show the (u, v) locations of all synthetic observations, where the innermost three have been highlighted. The red and orange contours show the regions where, respectively, the first- and third-order approximations to the phases (Equations 10 and C.1, respectively) differ from the true phases by less than 1°. The bottom panel shows a horizontal and vertical slice of the phases as well as the first- and third- order approximations as dashed and dotted lines, respectively.
Current usage metrics show cumulative count of Article Views (full-text article views including HTML views, PDF and ePub downloads, according to the available data) and Abstracts Views on Vision4Press platform.
Data correspond to usage on the plateform after 2015. The current usage metrics is available 48-96 hours after online publication and is updated daily on week days.
Initial download of the metrics may take a while.