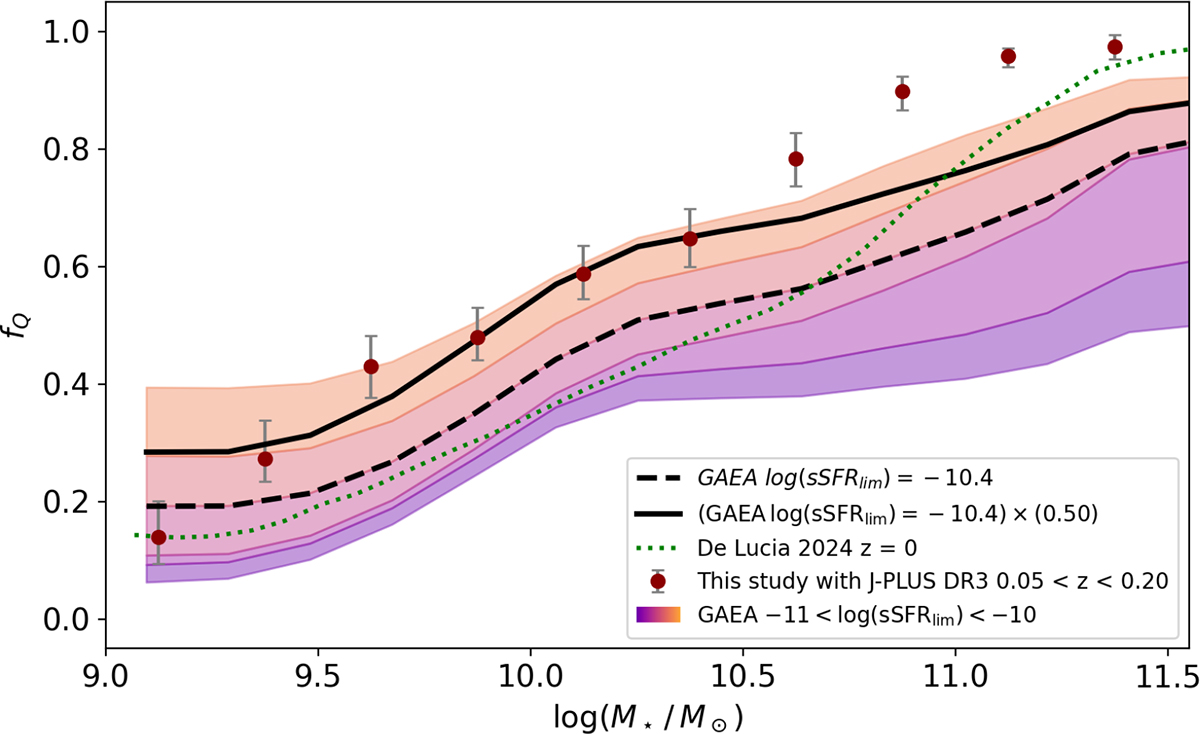
Fig. 12.
Download original image
fQ from J-PLUS DR3 (red dots) compared to GAEA predictions for different log(sSFRlim) thresholds (color-coded lines). We also show the GAEA2023 results from De Lucia et al. (2024) (dotted green line). The dashed black line shows the fQ for log(sSFRlim) = − 10.4, and the solid black line applies a −0.3 dex stellar mass correction to the GAEA SF population.
Current usage metrics show cumulative count of Article Views (full-text article views including HTML views, PDF and ePub downloads, according to the available data) and Abstracts Views on Vision4Press platform.
Data correspond to usage on the plateform after 2015. The current usage metrics is available 48-96 hours after online publication and is updated daily on week days.
Initial download of the metrics may take a while.