Fig. D.2.
Download original image
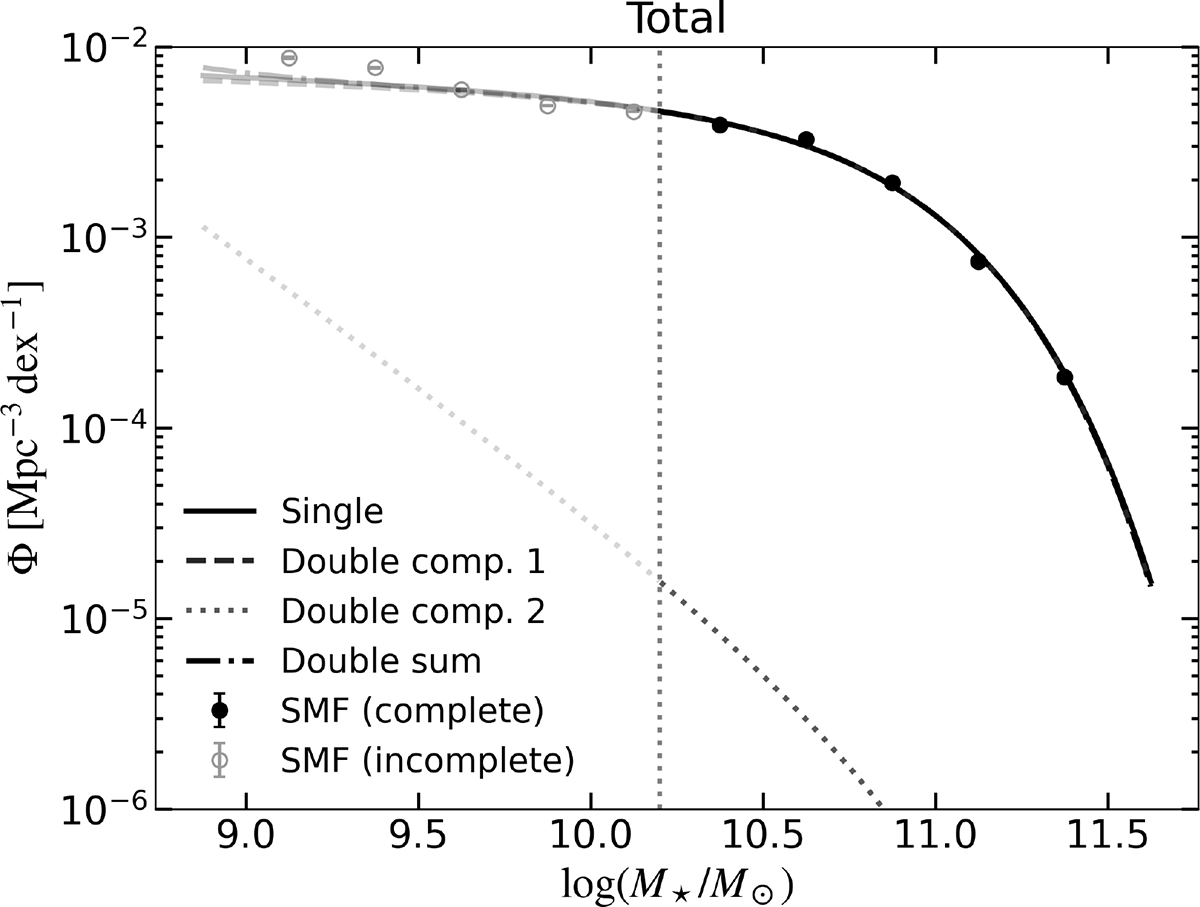
Double-Schechter decomposition for the total SMF. The observed SMF is shown with points and error bars. The two double-Schechter components are plotted separately (component 1: dashed; component 2: dotted), together with their sum (dash-dotted) and the best-fitting single-Schechter model (solid). The vertical dotted line marks the stellar-mass completeness limit at z = 0.2; bins below this limit are shown as gray open symbols, and model curves are faded below the completeness limit.
Current usage metrics show cumulative count of Article Views (full-text article views including HTML views, PDF and ePub downloads, according to the available data) and Abstracts Views on Vision4Press platform.
Data correspond to usage on the plateform after 2015. The current usage metrics is available 48-96 hours after online publication and is updated daily on week days.
Initial download of the metrics may take a while.