Open Access
Fig. 5.
Download original image
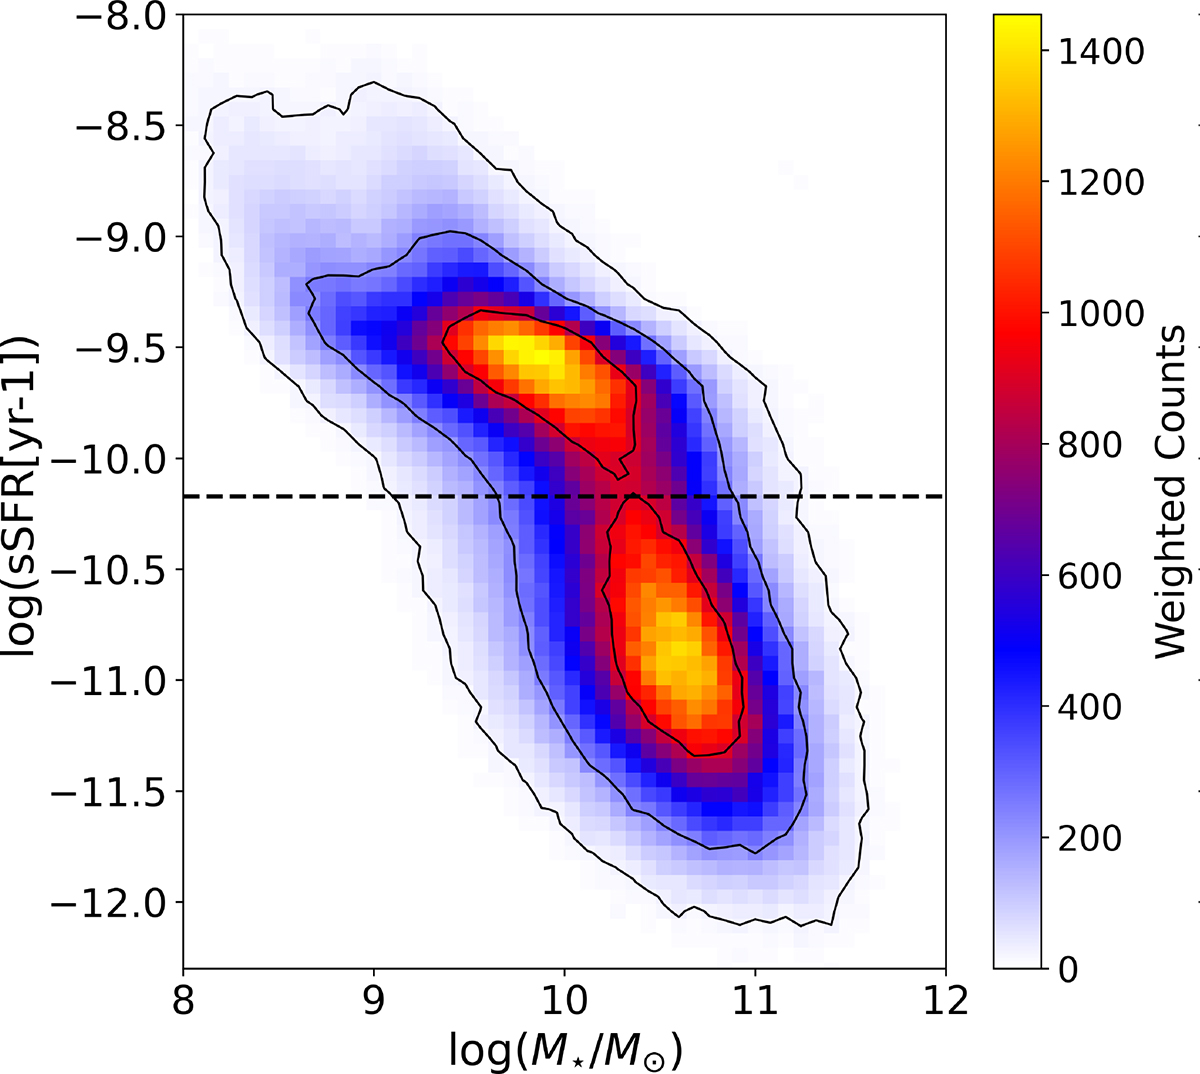
sSFR vs. stellar mass 2D odds-weighted histogram. The two maxima correspond to SF (higher sSFR values) and Q (lower sSFR values) populations. The limit between both populations is set to log sSFR = −10.2 dex (horizontal dashed line).
Current usage metrics show cumulative count of Article Views (full-text article views including HTML views, PDF and ePub downloads, according to the available data) and Abstracts Views on Vision4Press platform.
Data correspond to usage on the plateform after 2015. The current usage metrics is available 48-96 hours after online publication and is updated daily on week days.
Initial download of the metrics may take a while.