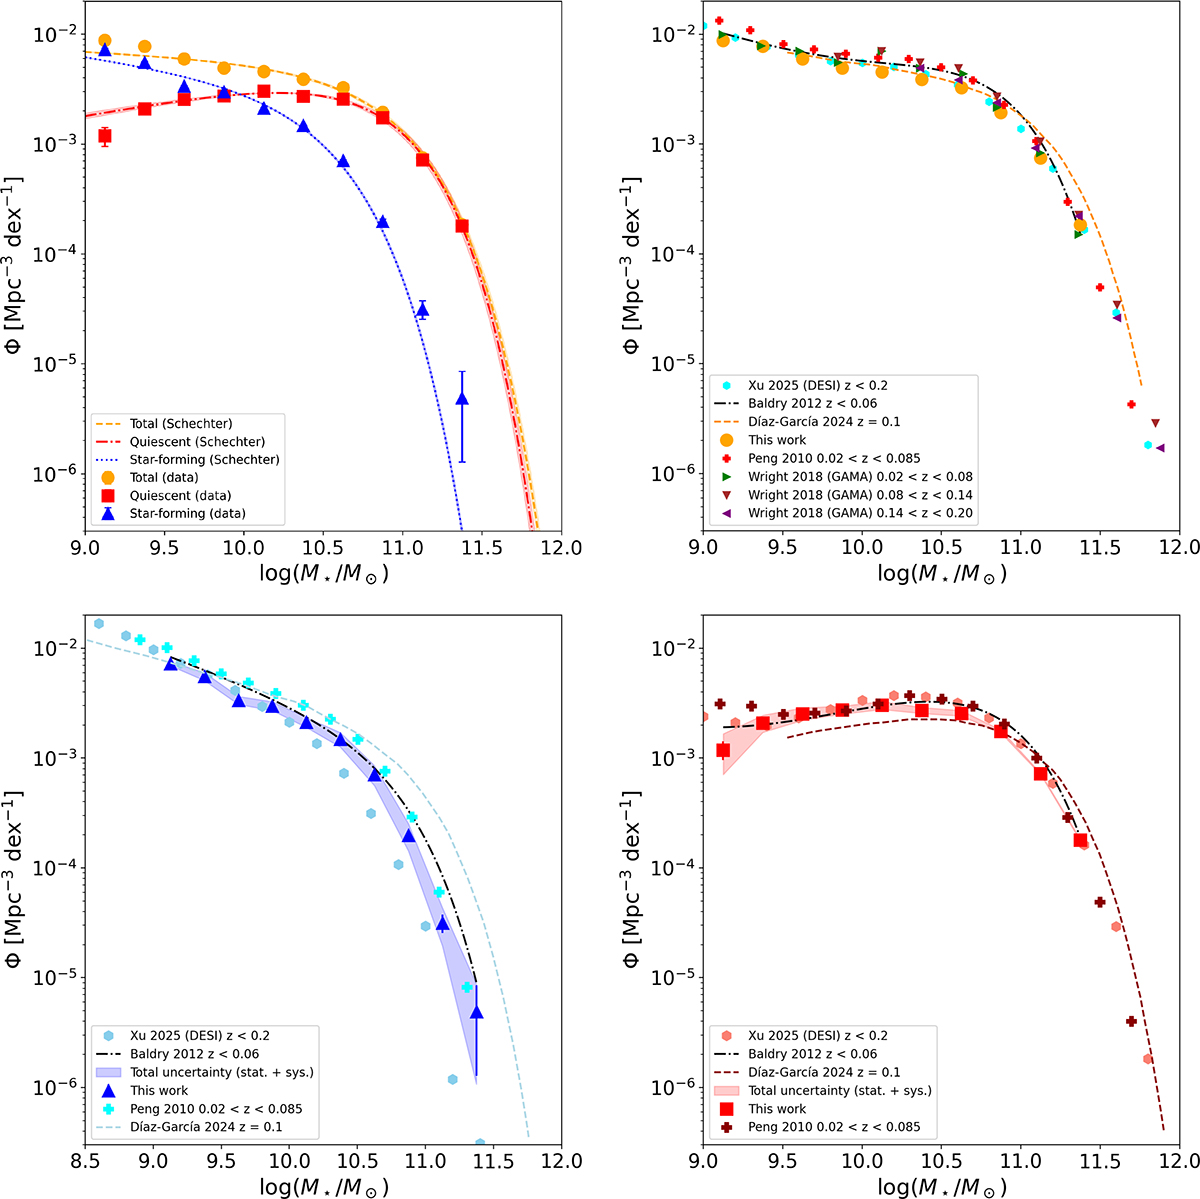
Fig. 8.
Download original image
(a) Total, Q, and SF-SMFs from this study shown as orange circles, red squares, and blue triangles, respectively, with bootstrapping errors. Schechter fits are shown as dashed orange, dash-dotted red, and dotted blue lines. (b) Total SMF from J-PLUS DR3 (orange circles), compared to Peng et al. (2010) (gray pluses), Xu et al. (2025) (cyan hexagons), Baldry et al. (2012) (purple points), and Díaz-García et al. (2024) (dashed orange curve). GAMA SMFs from Wright et al. (2018) are shown as green, brown, and purple triangles with different orientations. (c) SF-SMF from J-PLUS DR3 (blue triangles), with the blue-shaded region showing total uncertainty (statistical plus systematic). This is compared to Baldry et al. (2012) (dash-dotted black curve), Peng et al. (2010) (cyan pluses), Xu et al. (2025) (light-blue hexagons), and Díaz-García et al. (2024) (dashed light-blue curve). (d) Q-SMF from J-PLUS DR3 (red squares), with the total uncertainty shown as a red-shaded region. This is compared to Baldry et al. (2012) (dash-dotted black curve), Peng et al. (2010) (dark red pluses), Xu et al. (2025) (light-red hexagons), and Díaz-García et al. (2024) (dashed dark-red curve).
Current usage metrics show cumulative count of Article Views (full-text article views including HTML views, PDF and ePub downloads, according to the available data) and Abstracts Views on Vision4Press platform.
Data correspond to usage on the plateform after 2015. The current usage metrics is available 48-96 hours after online publication and is updated daily on week days.
Initial download of the metrics may take a while.