Open Access
Fig. 5.
Download original image
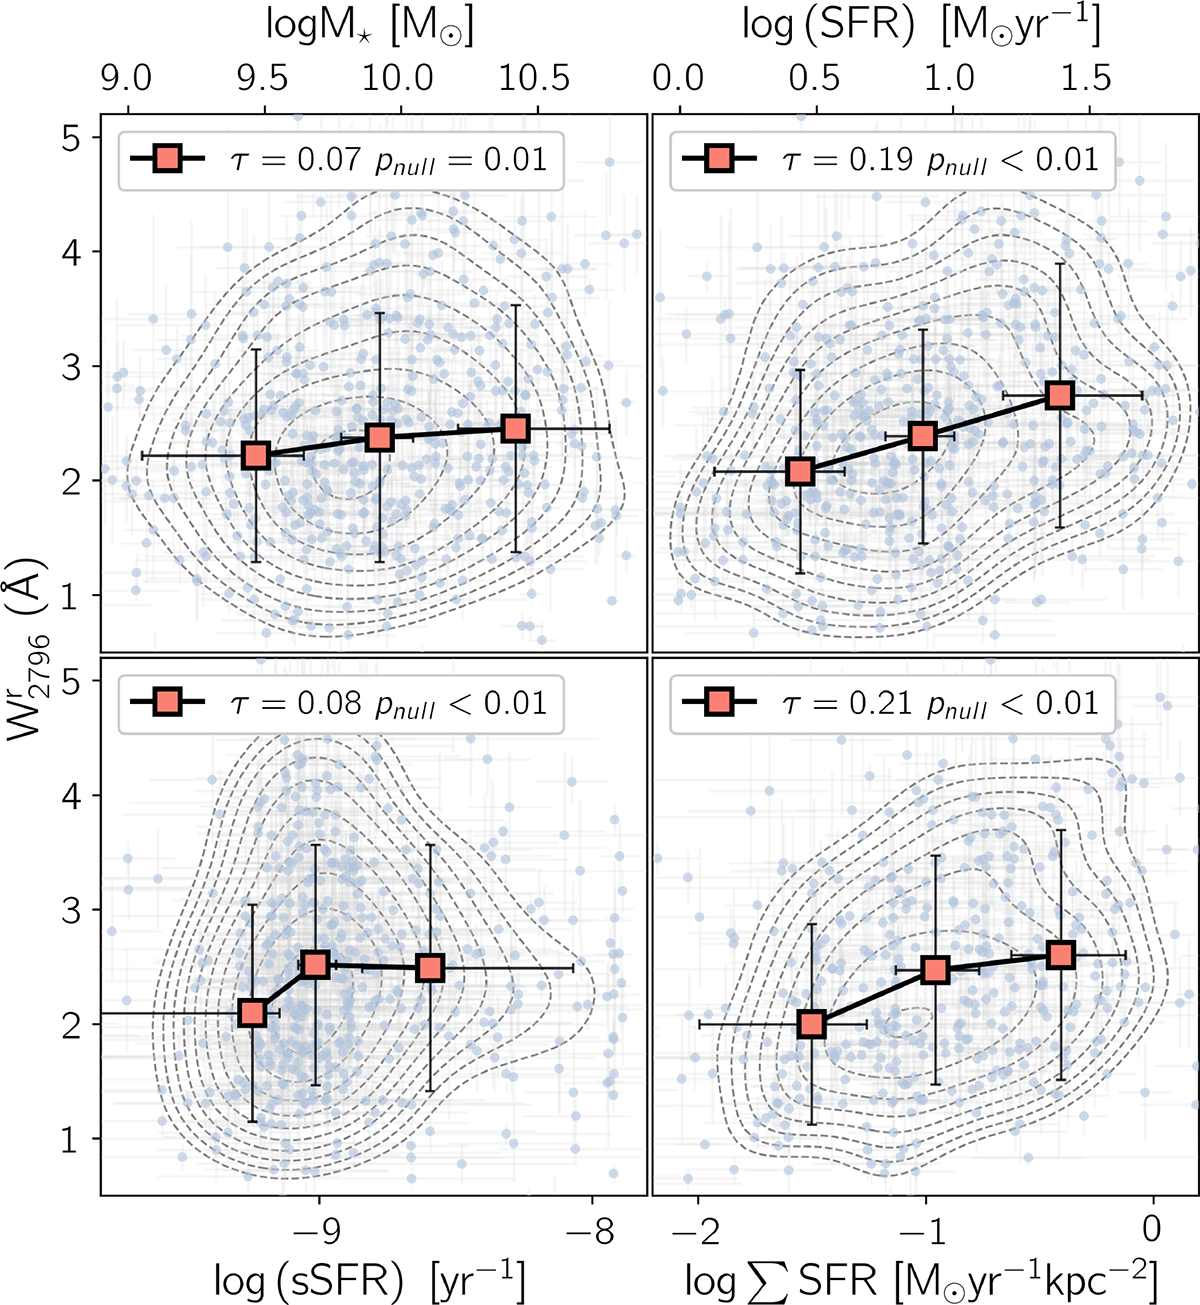
Distribution of Mg II equivalent width with the galaxy stellar mass (top left), SFR (top right), specific SFR (bottom left), and SFR surface density (bottom right). The square symbols represent the median values over three equal bins. The error bar represents the 68th percentile confidence interval.
Current usage metrics show cumulative count of Article Views (full-text article views including HTML views, PDF and ePub downloads, according to the available data) and Abstracts Views on Vision4Press platform.
Data correspond to usage on the plateform after 2015. The current usage metrics is available 48-96 hours after online publication and is updated daily on week days.
Initial download of the metrics may take a while.