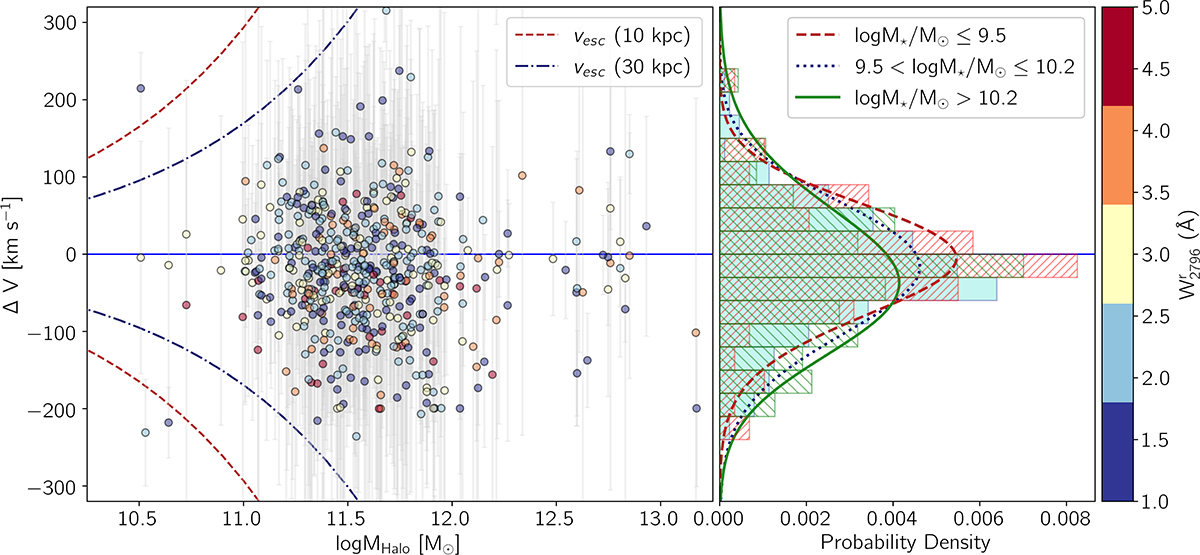
Fig. 8.
Download original image
Left: Relative Mg II absorption velocities to the galaxy systematic redshifts as a function of inferred dark matter halo mass; colour-coded with W2796. The line-of-sight projected halo escape velocities at distances 10 and 30 kpc, assuming an NFW profile of dark matter halos, are marked as dashed and dash-dotted curves. Right: Area-normalized histogram of relative velocity of Mg II absorbers in star-forming galaxies for three mass bins of log(M★/M⊙ ≤ 9.5 (hatched at 45°), 9.5 ≤ log(M★/M⊙)≤10.2 (hatched at −45°), and log(M★/M⊙ ≥ 10.2 (filled histogram). The Gaussian profile for the high-mass bin (solid curve) shows a higher velocity dispersion with σ = 97 km s−1 than σ = 73 km s−1, σ = 87 km s−1 for the respective low-mass bins of log(M★/M⊙)≤9.5 (dashed curve), and 9.5 ≤ log(M★/M⊙)≤10.2 (dotted curve).
Current usage metrics show cumulative count of Article Views (full-text article views including HTML views, PDF and ePub downloads, according to the available data) and Abstracts Views on Vision4Press platform.
Data correspond to usage on the plateform after 2015. The current usage metrics is available 48-96 hours after online publication and is updated daily on week days.
Initial download of the metrics may take a while.