Fig. 10
Download original image
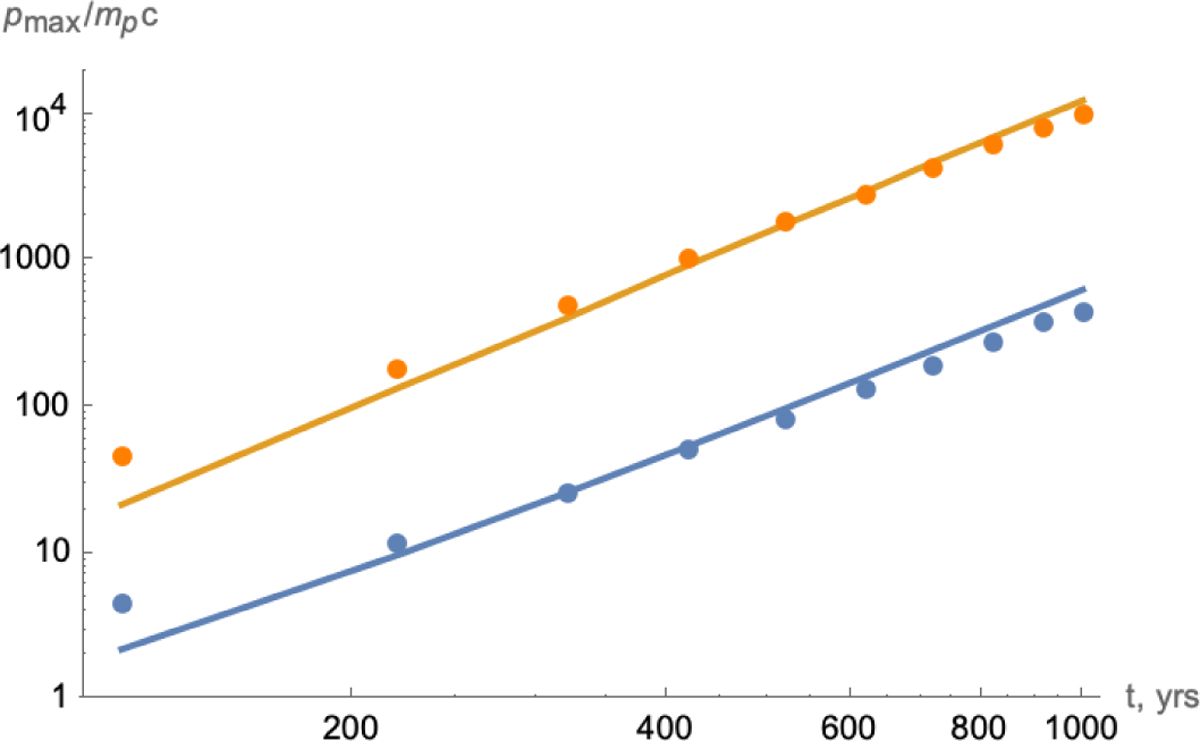
Maximum momenta pmax for two numerical solutions (dots) and from analytical expressions (solid lines). The blue line is from Eq. (14) and the dots are from the numerical solution with uniform u2 (dashed lines in Fig. 8). The orange line is calculated with Eq. (15) with xp1 and xp2 from (1) and the dots are from the numerical solution with xB = 0.03R, uAB = −2u1 (solid lines on Fig. 8). The value of pmax is measured at the level where the distribution function drops below the power-law extrapolation in e times for the orange dots and in 10 times for the blue dots.
Current usage metrics show cumulative count of Article Views (full-text article views including HTML views, PDF and ePub downloads, according to the available data) and Abstracts Views on Vision4Press platform.
Data correspond to usage on the plateform after 2015. The current usage metrics is available 48-96 hours after online publication and is updated daily on week days.
Initial download of the metrics may take a while.