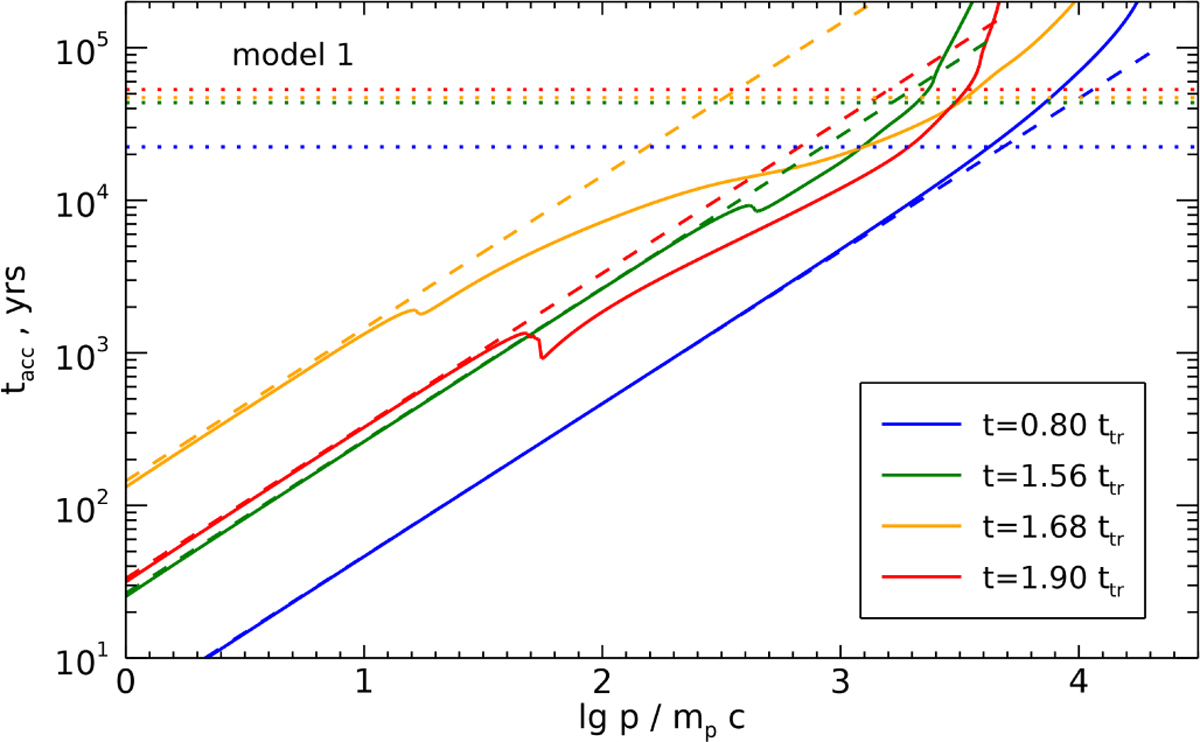
Fig. 11
Download original image
Mean acceleration time ⟨tacc(p)⟩ for our numerical model 1 and Bohm diffusion coefficient. The solid lines show calculations with Eqs. (15) and (1) for xp. The colored lines are calculated with the spatial distributions of MHD parameters relevant to the time moments t shown in the legend. The dashed lines of the same color correspond to the same time moments and uniform flow, Eq. (14) with βa = 6.67. The dotted horizontal lines are added to guide the eye; they correspond to the time moments shown in the legend.
Current usage metrics show cumulative count of Article Views (full-text article views including HTML views, PDF and ePub downloads, according to the available data) and Abstracts Views on Vision4Press platform.
Data correspond to usage on the plateform after 2015. The current usage metrics is available 48-96 hours after online publication and is updated daily on week days.
Initial download of the metrics may take a while.