Fig. 12
Download original image
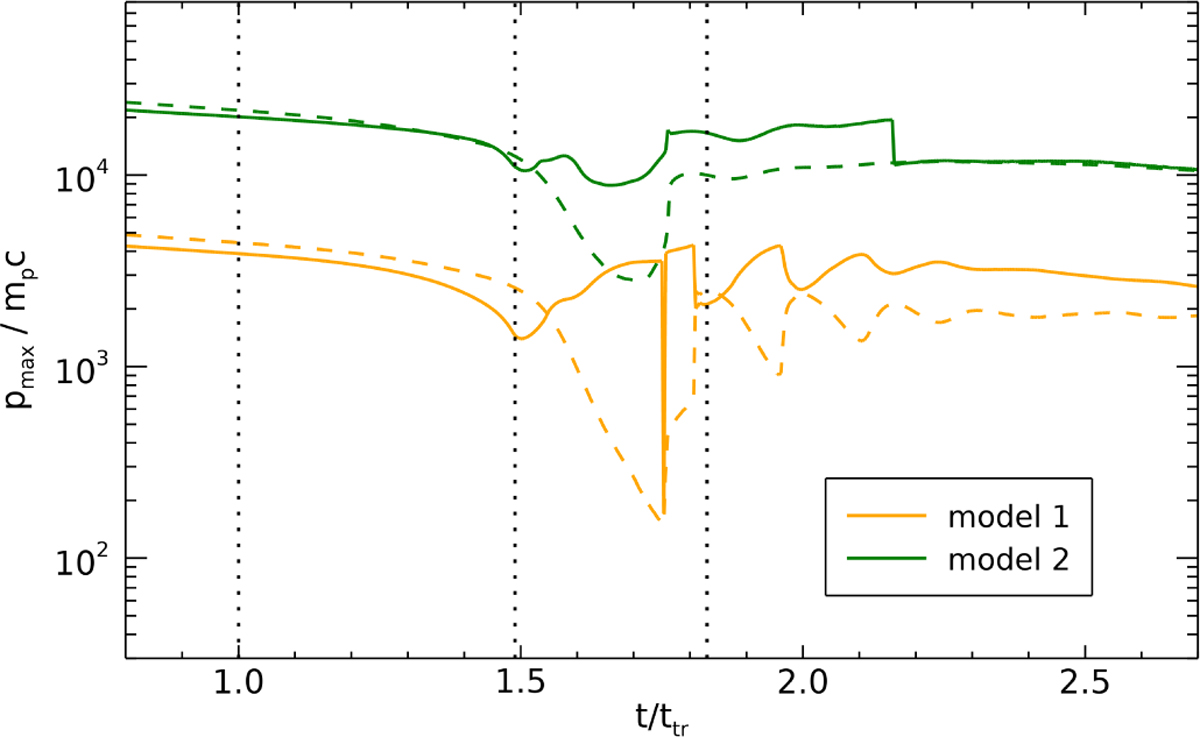
Time-limited maximum momentum for our MHD models and Bohm diffusion coefficient. As in Fig. 11, the solid lines represent calculations with the spatial structure of the flow, while the dashed lines are for the uniform flow. The three vertical lines mark the times ttr (left), 1.49ttr (when the region with negative u2 appears), and tsf (right).
Current usage metrics show cumulative count of Article Views (full-text article views including HTML views, PDF and ePub downloads, according to the available data) and Abstracts Views on Vision4Press platform.
Data correspond to usage on the plateform after 2015. The current usage metrics is available 48-96 hours after online publication and is updated daily on week days.
Initial download of the metrics may take a while.