Fig. 2
Download original image
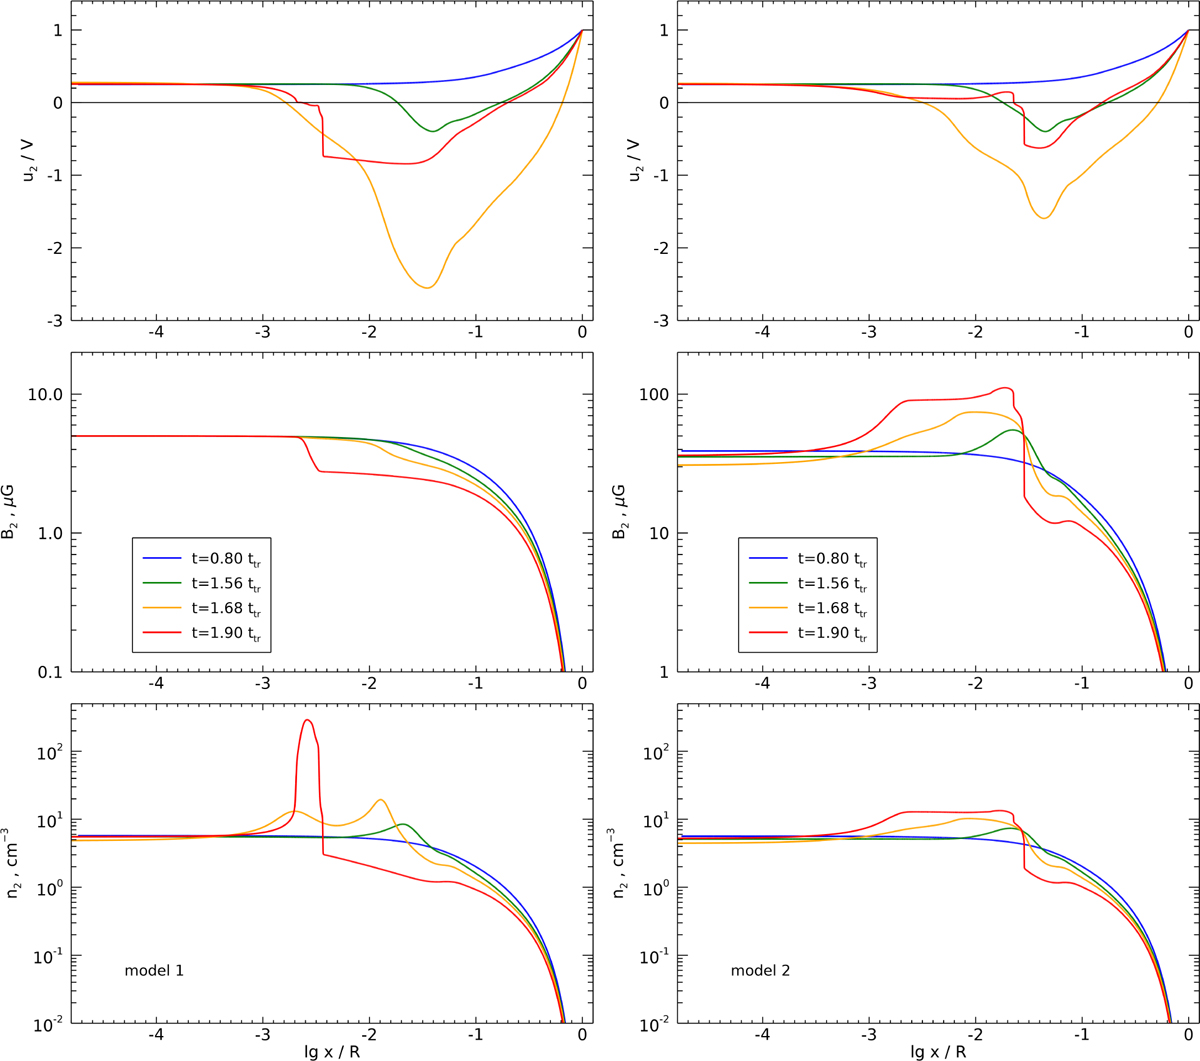
Spatial distributions of the flow speed u2, magnetic field strength B2, and number density n2 downstream of the shock at several moments of time. The left column is for model 1 and the right column for model 2. The coordinate x marks the distance from the shock, which is used for considerations of the CR acceleration. We note that the horizontal axes are in the log scale. This is necessary to describe equally well the variations on both small and large scales relative to the shock position, which are probed by particles with momenta spanning several decades. The shock is located on the left of each plot, at x/R = 0. The SNR center is on the right, at the point with lg(x/R) = 0.
Current usage metrics show cumulative count of Article Views (full-text article views including HTML views, PDF and ePub downloads, according to the available data) and Abstracts Views on Vision4Press platform.
Data correspond to usage on the plateform after 2015. The current usage metrics is available 48-96 hours after online publication and is updated daily on week days.
Initial download of the metrics may take a while.