Fig. 4
Download original image
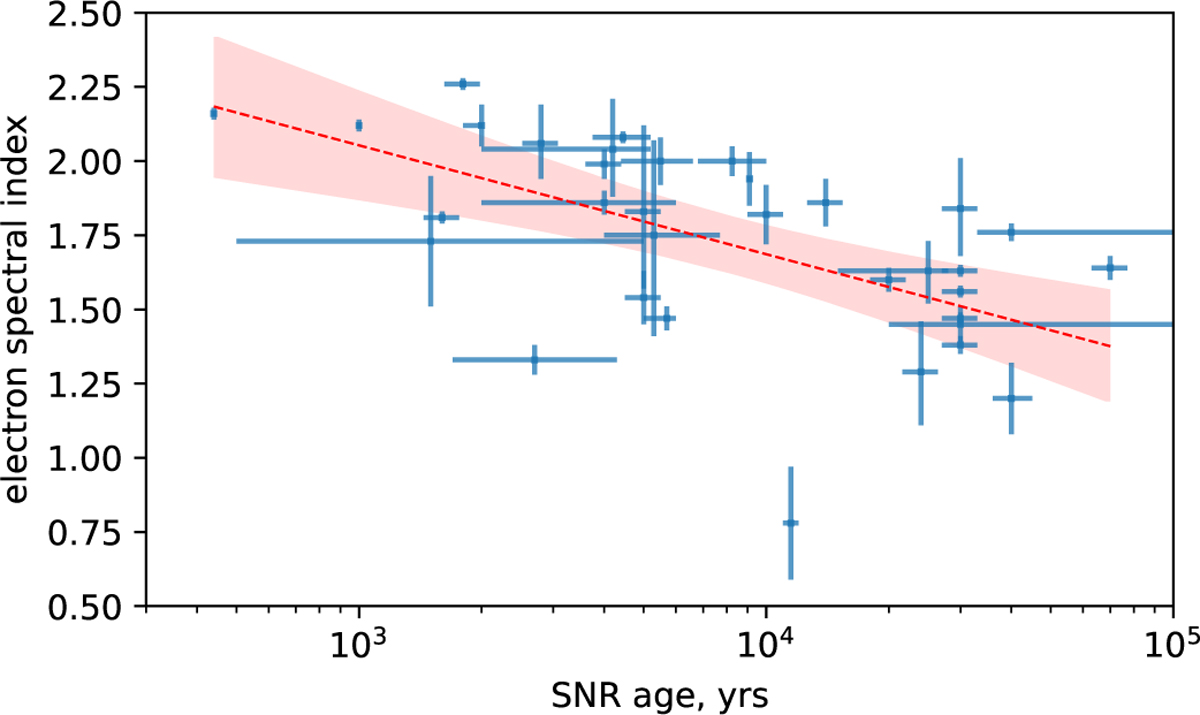
Electron spectral index vs. age for a sample of SNRs with the radio and GeV γ-ray emission detected, from the data given by Zeng et al. (2019). The red dashed line represents a linear fit between the index and logarithm of age, with the slope k = −0.37 ± 0.05. The red area shows the 1σ uncertainty. We excluded MSH 15-56 from the sample because its radio emission is likely dominated by a pulsar. There are a few SNRs with two values of α estimated in this reference. We calculated the average α from the two values if the uncertainty is due to various estimates of the ambient density (Tycho, G166.0+4.3, S147, CTB 73B). We use only one value for W51C, RX J0852-4622, namely that which corresponds to the same spectral model as used for other SNRs.
Current usage metrics show cumulative count of Article Views (full-text article views including HTML views, PDF and ePub downloads, according to the available data) and Abstracts Views on Vision4Press platform.
Data correspond to usage on the plateform after 2015. The current usage metrics is available 48-96 hours after online publication and is updated daily on week days.
Initial download of the metrics may take a while.