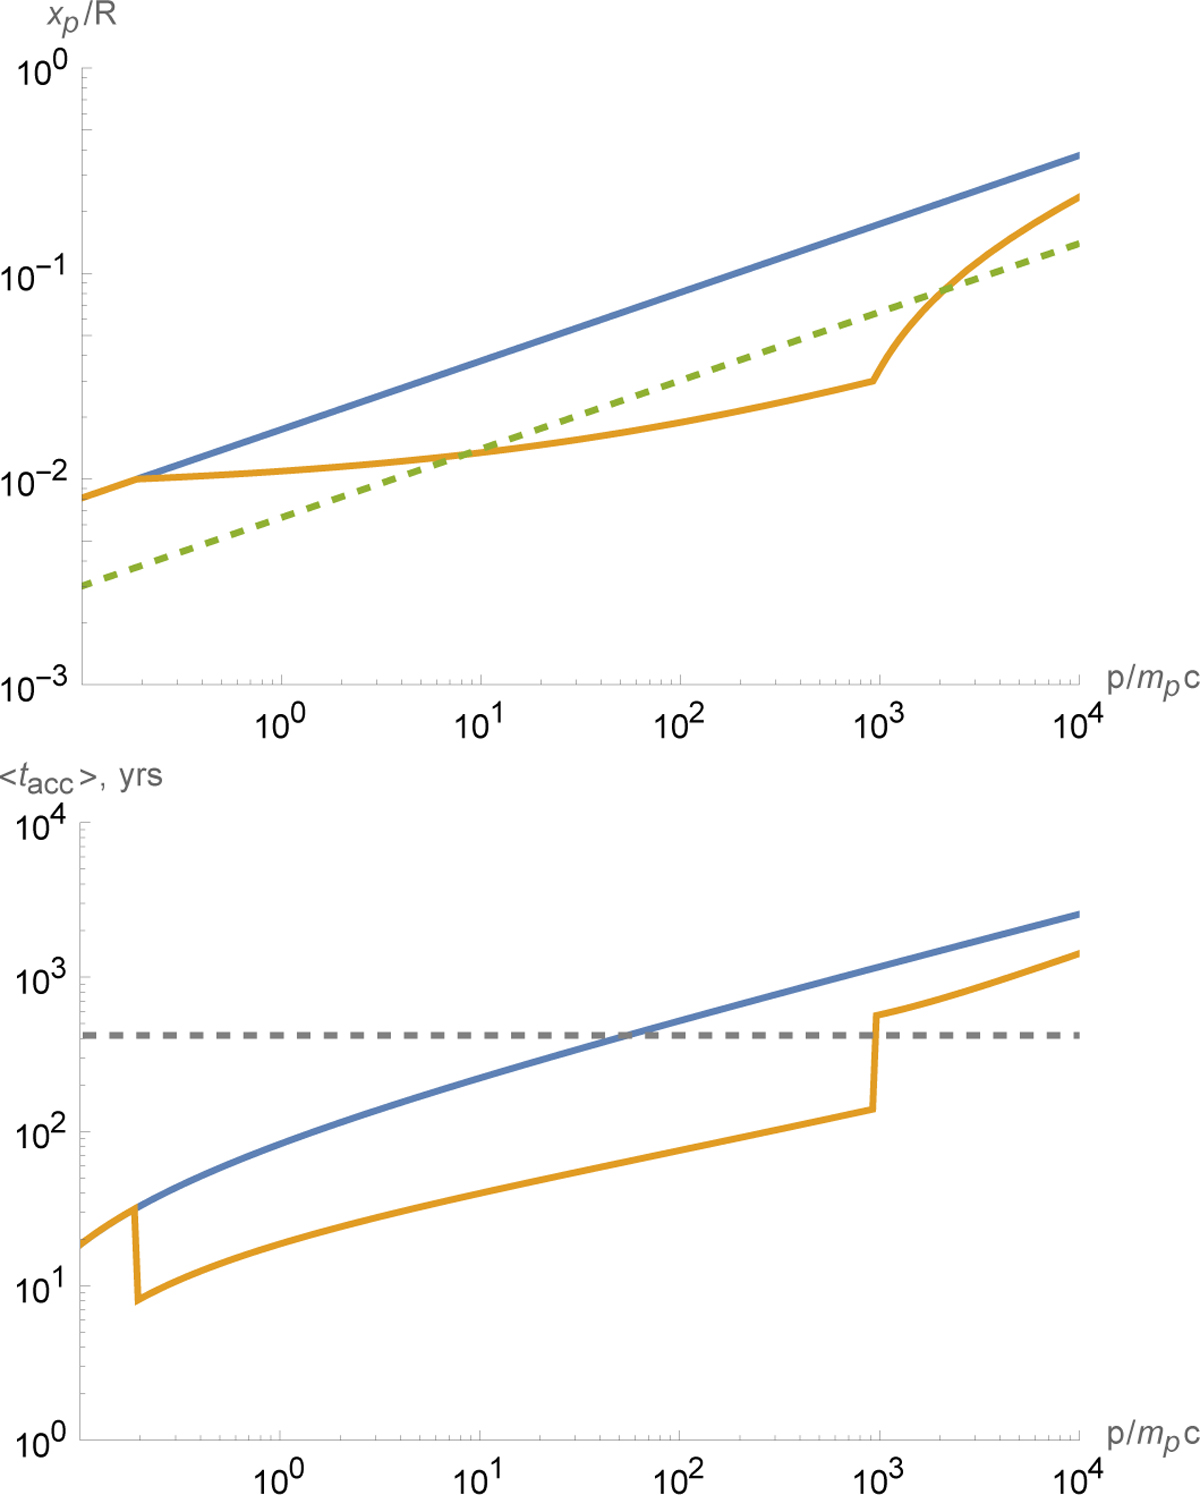
Fig. 9
Download original image
Diffusion length xp2(p) (top) and mean acceleration time ⟨tacc(p)⟩ (bottom) calculated in the analytical approach (i.e., it is time-independent). The model with xA = 0.01R, xB = 0.03R, uAB = −2u1 is shown with the orange line; it is calculated with Eqs. (1) and (15). The model with uniform u2 is shown with the blue line, as from xp = D2/u2 (then simply xp ∝ p1/3) and (14) for acceleration time. The green dashed line shows xp1(p) upstream, and the gray dashed line corresponds to t = 420 yr.
Current usage metrics show cumulative count of Article Views (full-text article views including HTML views, PDF and ePub downloads, according to the available data) and Abstracts Views on Vision4Press platform.
Data correspond to usage on the plateform after 2015. The current usage metrics is available 48-96 hours after online publication and is updated daily on week days.
Initial download of the metrics may take a while.