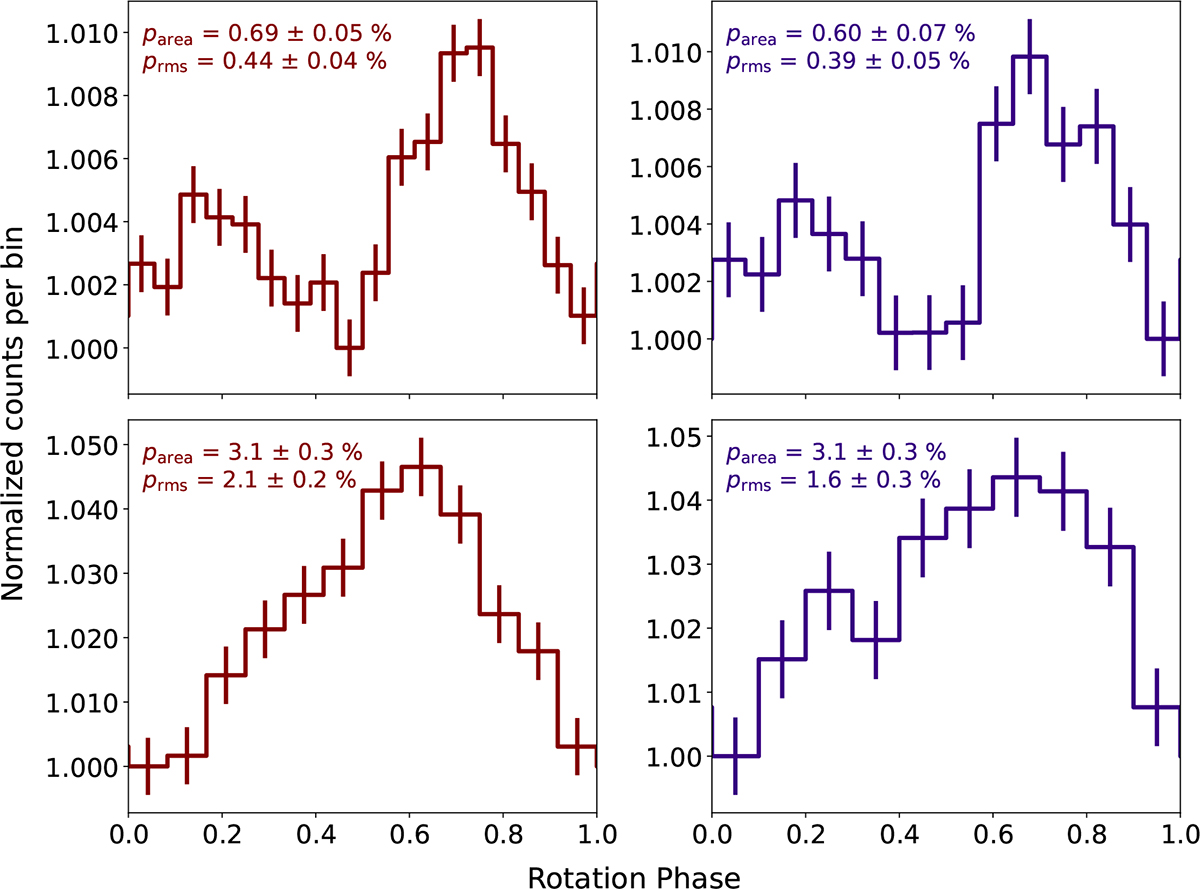
Fig. 2.
Download original image
Top: Typical double-peaked pulse profiles obtained by phase folding together the Nov 14 and Nov 15 light curves and excluding the single-peaked interval. The red and blue channels are shown on the left and right, respectively. Bottom: Averaged single-peaked pulse profiles of the 220-second-long interval. Corresponding pulsed fractions parea and prms are shown in each panel.
Current usage metrics show cumulative count of Article Views (full-text article views including HTML views, PDF and ePub downloads, according to the available data) and Abstracts Views on Vision4Press platform.
Data correspond to usage on the plateform after 2015. The current usage metrics is available 48-96 hours after online publication and is updated daily on week days.
Initial download of the metrics may take a while.