Fig. 8
Download original image
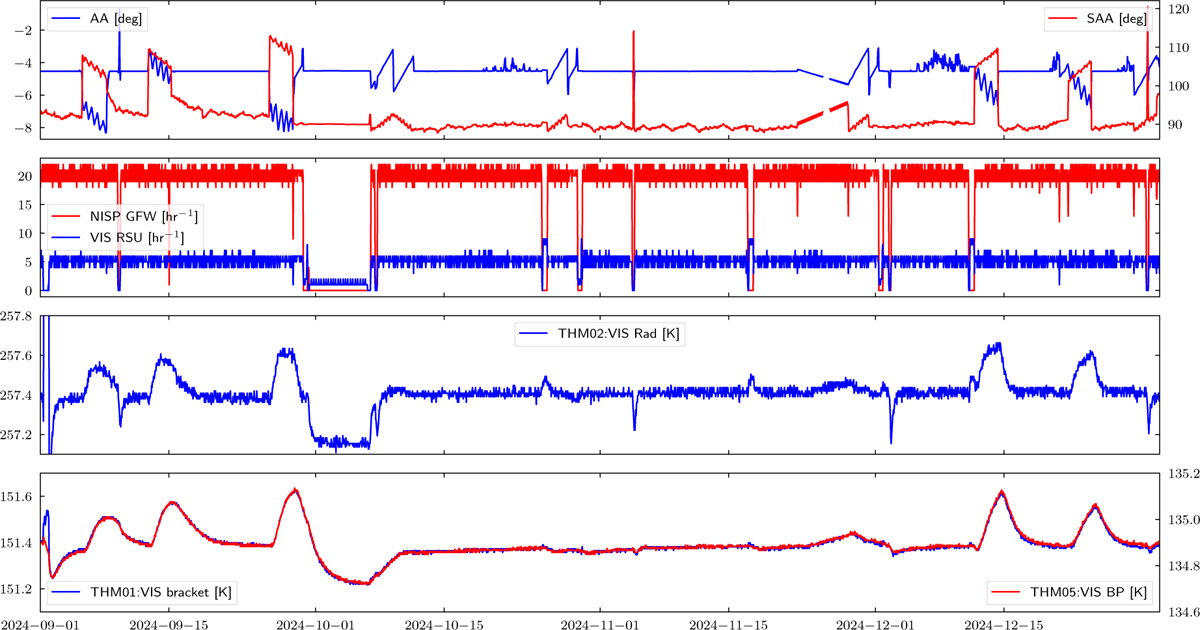
Time histories of spacecraft attitude and thermal performance parameters obtained from spacecraft telemetry during the period from 2024-09-01 00:00:00 UTC until 2025-01-01 00:00:00 UTC. Upper panel: variations in SAA and AA. Upper middle panel: history of the cadence (in cycles per hour) of the NISP GFW (red line) and the VIS RSU (blue line). Lower middle panel: history of the VIS radiator temperature from the sensor THM02. Lower panel: temperature responses of the baseplate sensor placed near the VIS bracket THM05 (red line) and a sensor THM01 directly on the VIS FPA bracket (blue line).
Current usage metrics show cumulative count of Article Views (full-text article views including HTML views, PDF and ePub downloads, according to the available data) and Abstracts Views on Vision4Press platform.
Data correspond to usage on the plateform after 2015. The current usage metrics is available 48-96 hours after online publication and is updated daily on week days.
Initial download of the metrics may take a while.