Fig. 9
Download original image
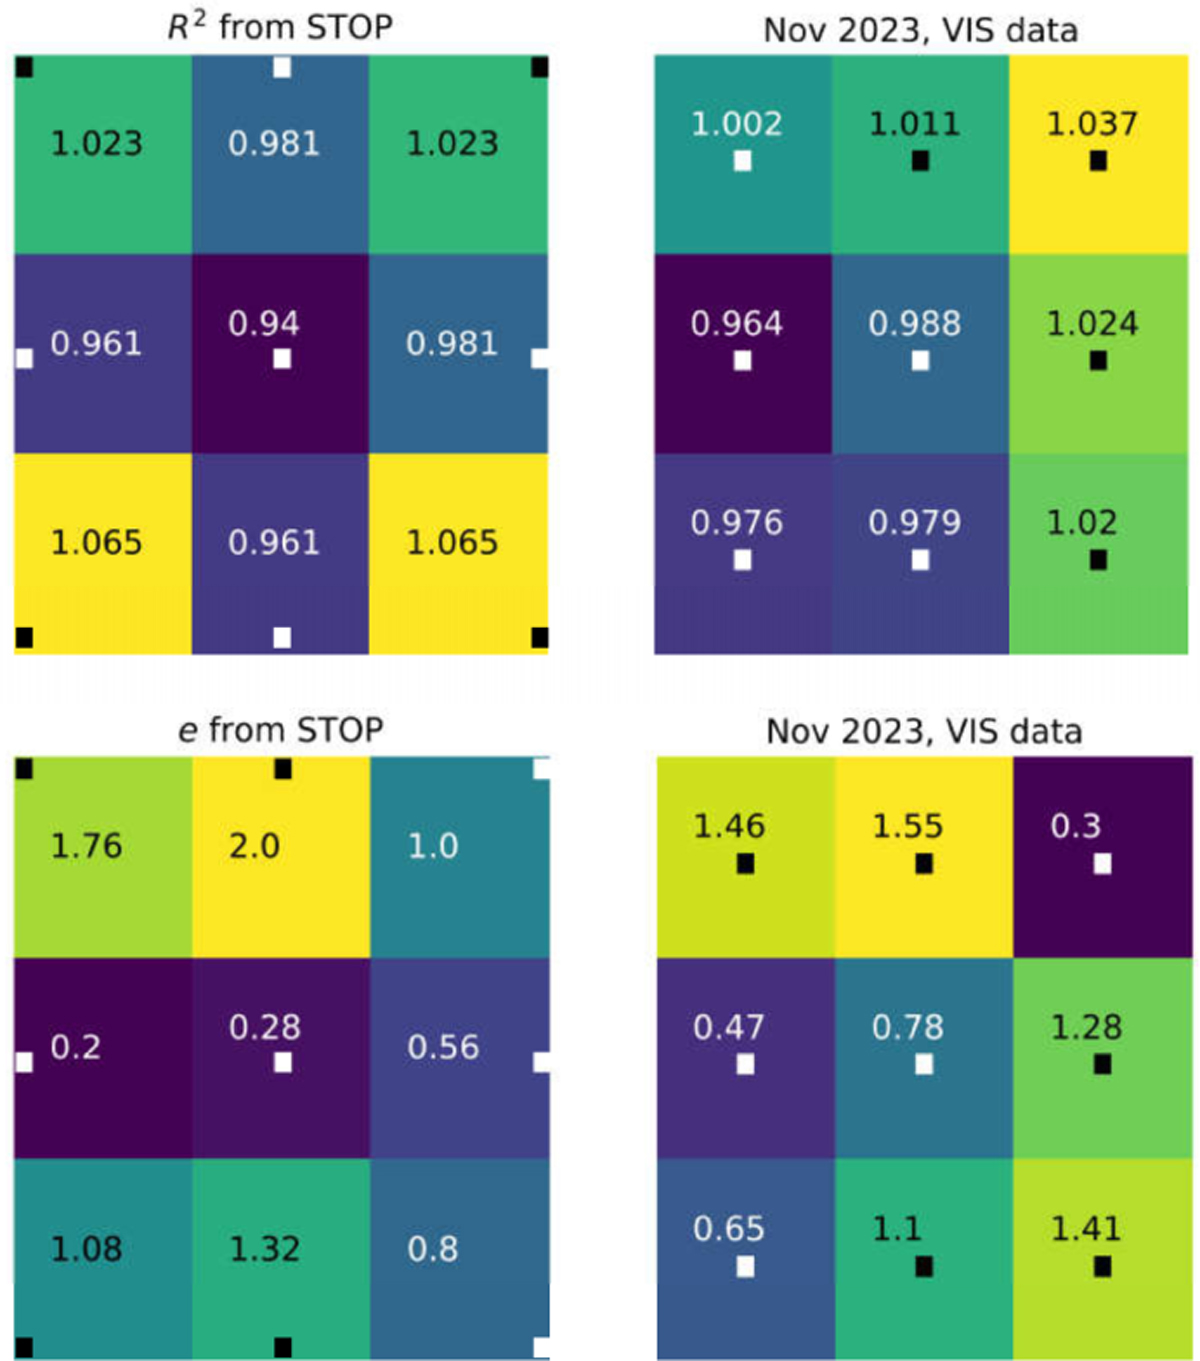
Visualisation of the relative variation of R2 and e over the VIS focal plane, +X to the right and +Y going up. The values have been normalised by the average of the nine values, with an average R2 of 0.0479 and 0.0199 arcsec2 and an average e of 0.025 and 0.021 for the STOP and in-orbit data, respectively. The difference between the values are due to the use of a different Gaussian weighting in the calculation of the moments (see Sect. 5.3.2). The squares mark the reference positions on the FPA where the values have been obtained. Left diagrams: relative R2 (top) and e (bottom) predicted by the STOP analysis. Right diagrams: relative R2 and e measured in orbit in November 2023.
Current usage metrics show cumulative count of Article Views (full-text article views including HTML views, PDF and ePub downloads, according to the available data) and Abstracts Views on Vision4Press platform.
Data correspond to usage on the plateform after 2015. The current usage metrics is available 48-96 hours after online publication and is updated daily on week days.
Initial download of the metrics may take a while.