Fig. 11.
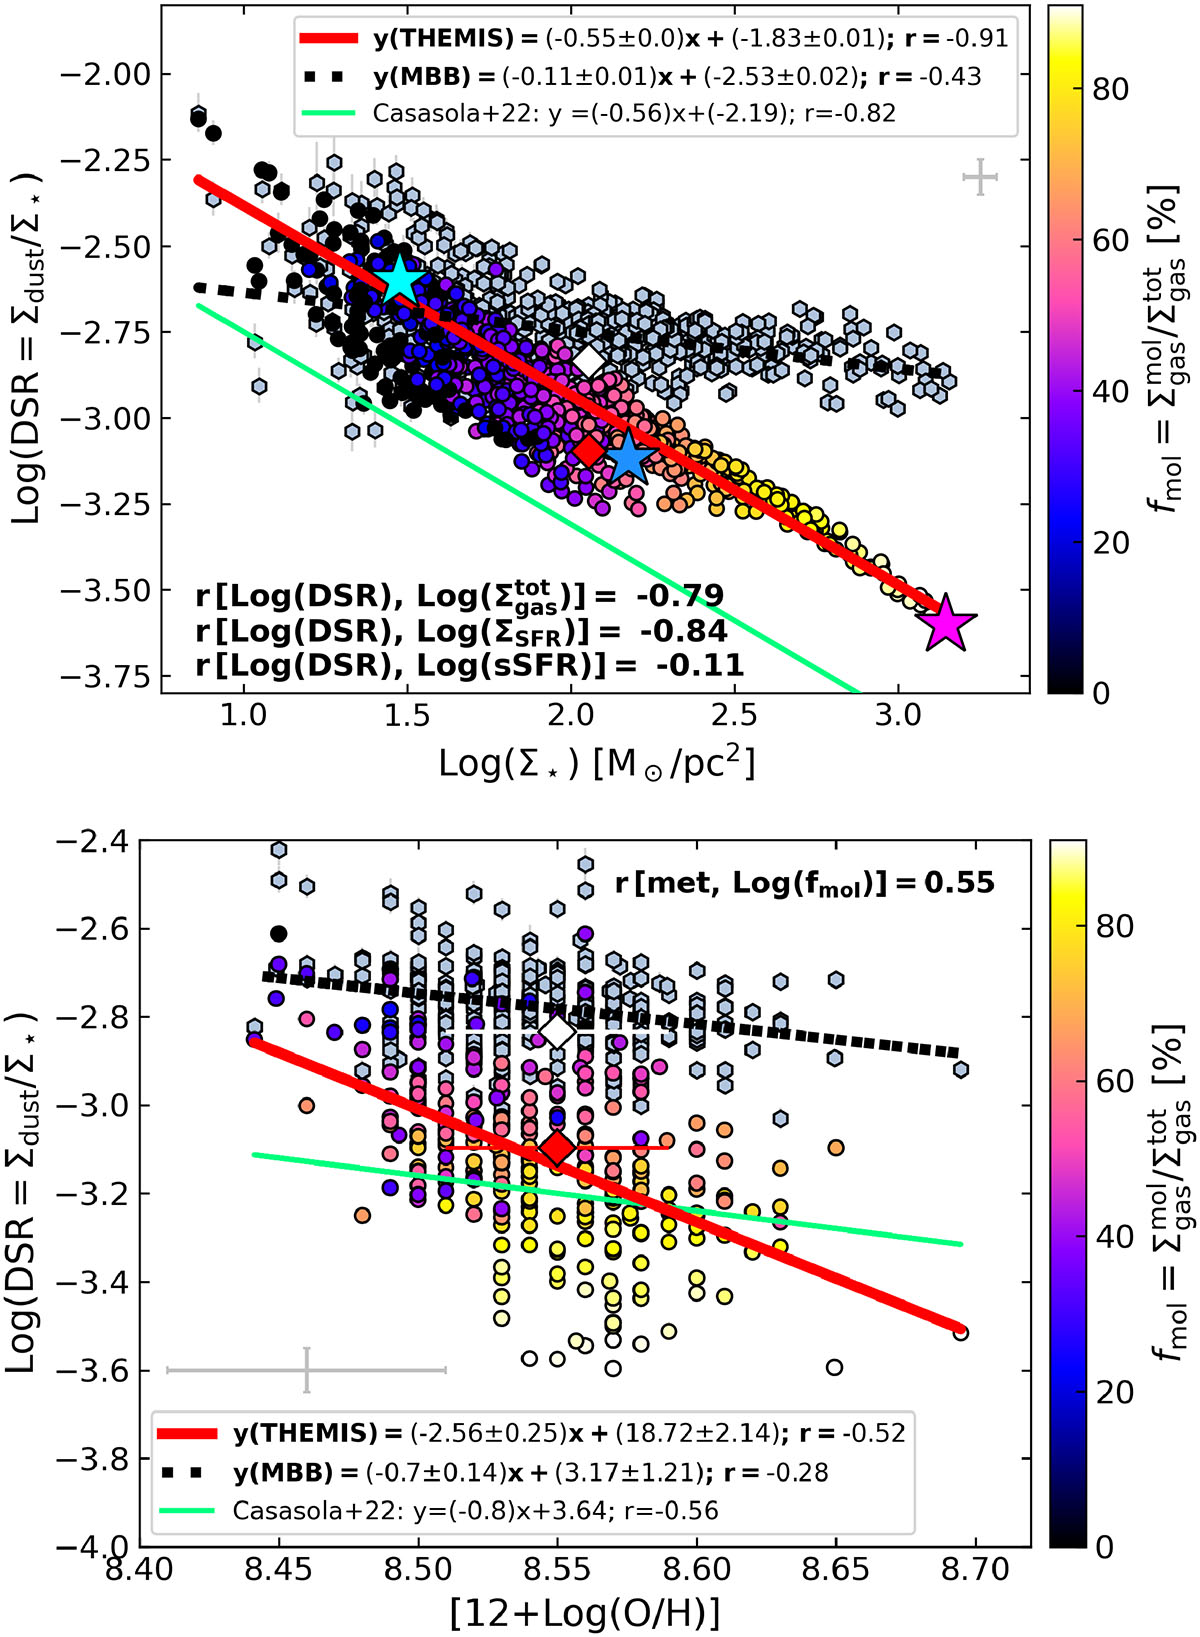
Download original image
Dust-to-stellar mass ratio scaling relations with stellar mass surface density (Σ★, top) and gas metallicity (bottom) in M 99. Filled circles show the THEMIS dust masses, colour-coded by molecular gas fraction (fmol); grey hexagons correspond to single-T MBB dust masses. Each symbol represents an 8″ ∼ 560 pc pixel. The angular resolution is 25″ ∼ 1.75 kpc. The bottom panel is restricted to the region covered by the metallicity map (Fig. B.5). Solid red and dashed black lines show the best-fit relations for THEMIS and MBB, respectively; green lines show correlations from Casasola et al. (2022). Red and white diamonds mark integrated values from THEMIS and MBB fits, while filled stars in the top panel indicate disc (cyan), spiral arms (blue), and centre (magenta) averages. Calibration uncertainties are indicated by grey bars near the legend.
Current usage metrics show cumulative count of Article Views (full-text article views including HTML views, PDF and ePub downloads, according to the available data) and Abstracts Views on Vision4Press platform.
Data correspond to usage on the plateform after 2015. The current usage metrics is available 48-96 hours after online publication and is updated daily on week days.
Initial download of the metrics may take a while.