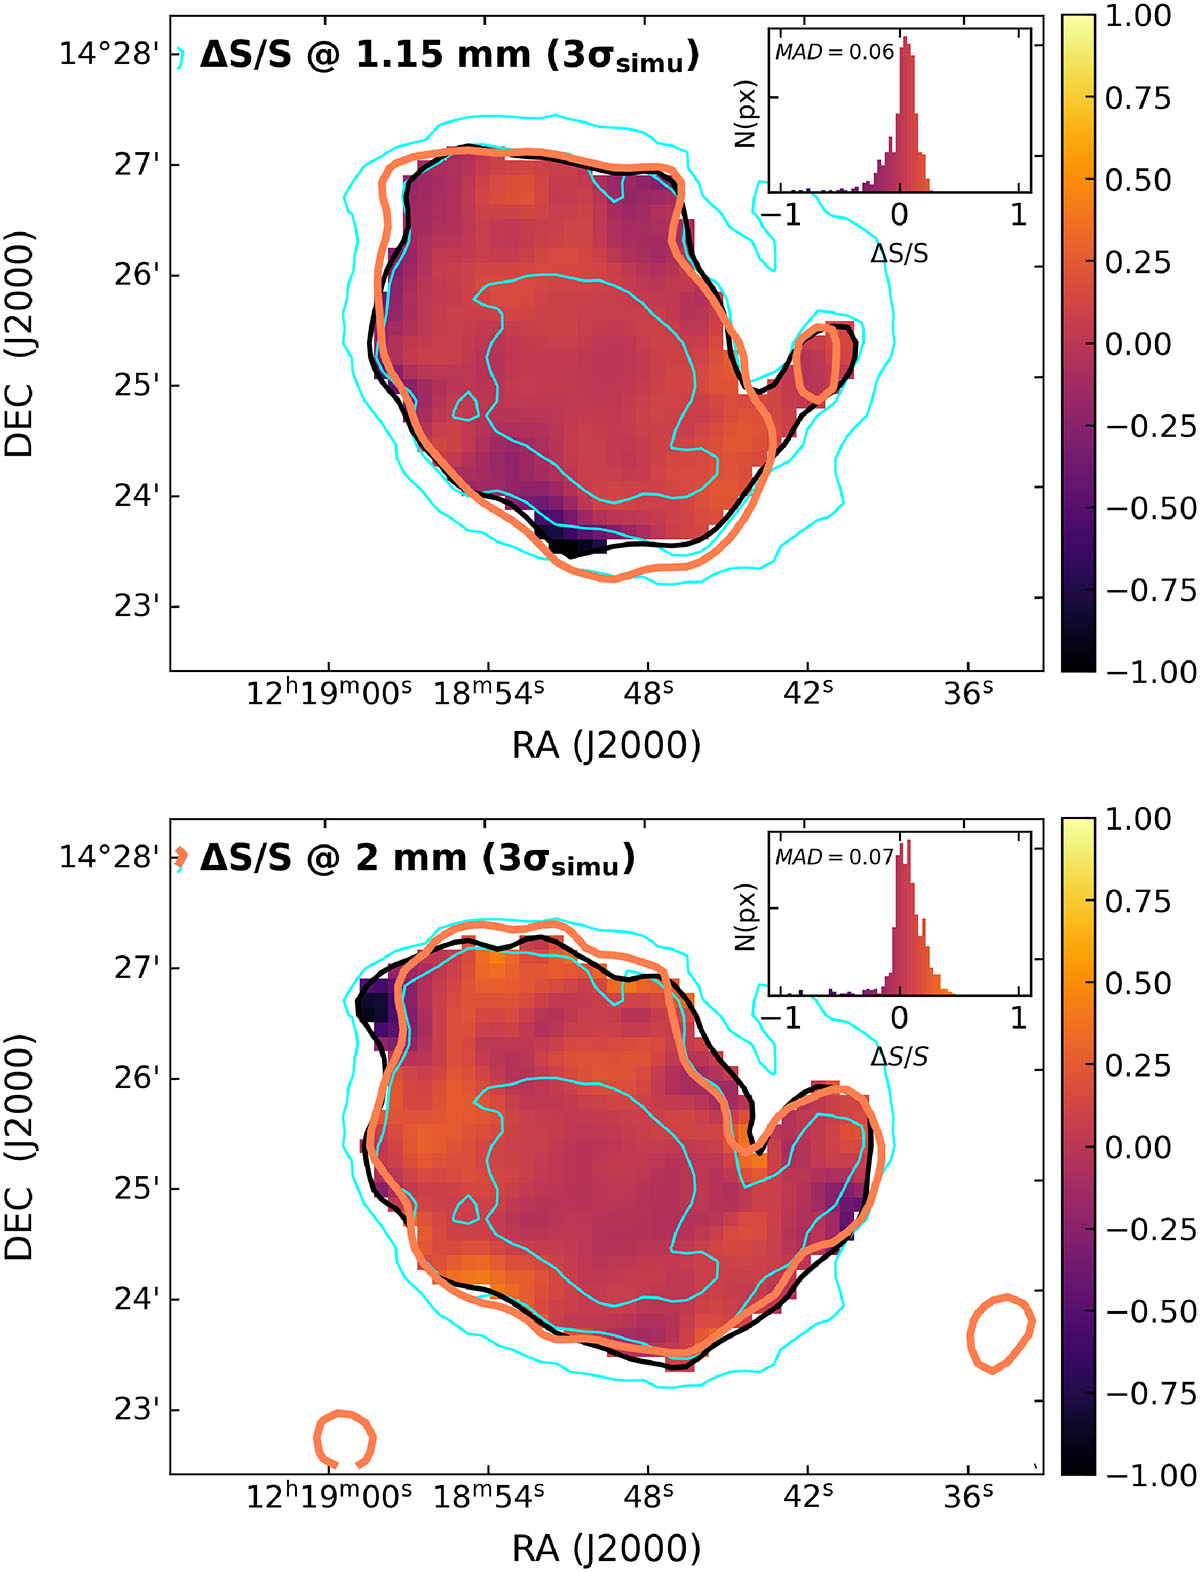
Fig. A.3.
Download original image
Relative differences between the original and simulated SPIRE 250 μm maps, using 1.15 mm noise and mask (top) and 2 mm noise and mask (bottom). All images are degraded and resampled to the SPIRE 350 μm resolution. The 3σ level from the simulated maps (3σsimu) is shown in black, with corresponding NIKA2 contours in orange. Cyan contours show the original SPIRE 250 μm emission (as in Fig. A.1). Figure insets display the distribution of relative differences (ΔS), with MAD values of 0.06 (1.15 mm) and 0.07 (2 mm), both approximated to 0.1.
Current usage metrics show cumulative count of Article Views (full-text article views including HTML views, PDF and ePub downloads, according to the available data) and Abstracts Views on Vision4Press platform.
Data correspond to usage on the plateform after 2015. The current usage metrics is available 48-96 hours after online publication and is updated daily on week days.
Initial download of the metrics may take a while.