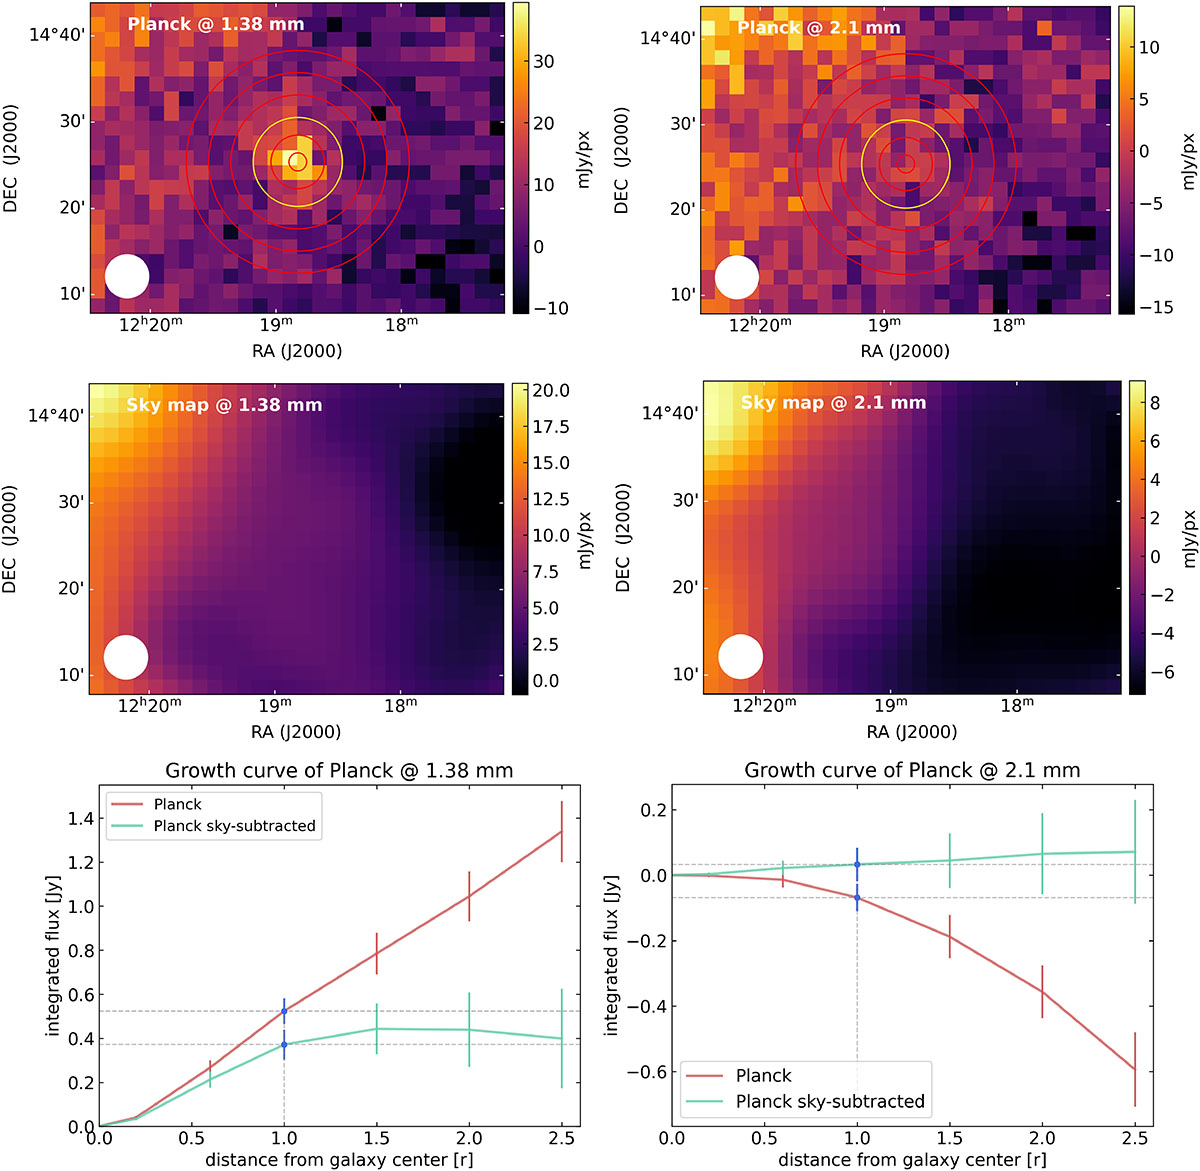
Fig. A.4.
Download original image
Original Planck maps of M 99 at 1.38 mm and 2.1 mm (top panels), overlaid with the circles used for computing the growth curve. The modelled sky maps are shown in the central panels. Bottom panels show the growth curves computed on the original Planck maps (red solid lines) and on the sky-subtracted maps (green solid lines). The blue-filled circles indicate the value of the integrated flux, corresponding to the yellow circles in the top panels (r = 300″).
Current usage metrics show cumulative count of Article Views (full-text article views including HTML views, PDF and ePub downloads, according to the available data) and Abstracts Views on Vision4Press platform.
Data correspond to usage on the plateform after 2015. The current usage metrics is available 48-96 hours after online publication and is updated daily on week days.
Initial download of the metrics may take a while.