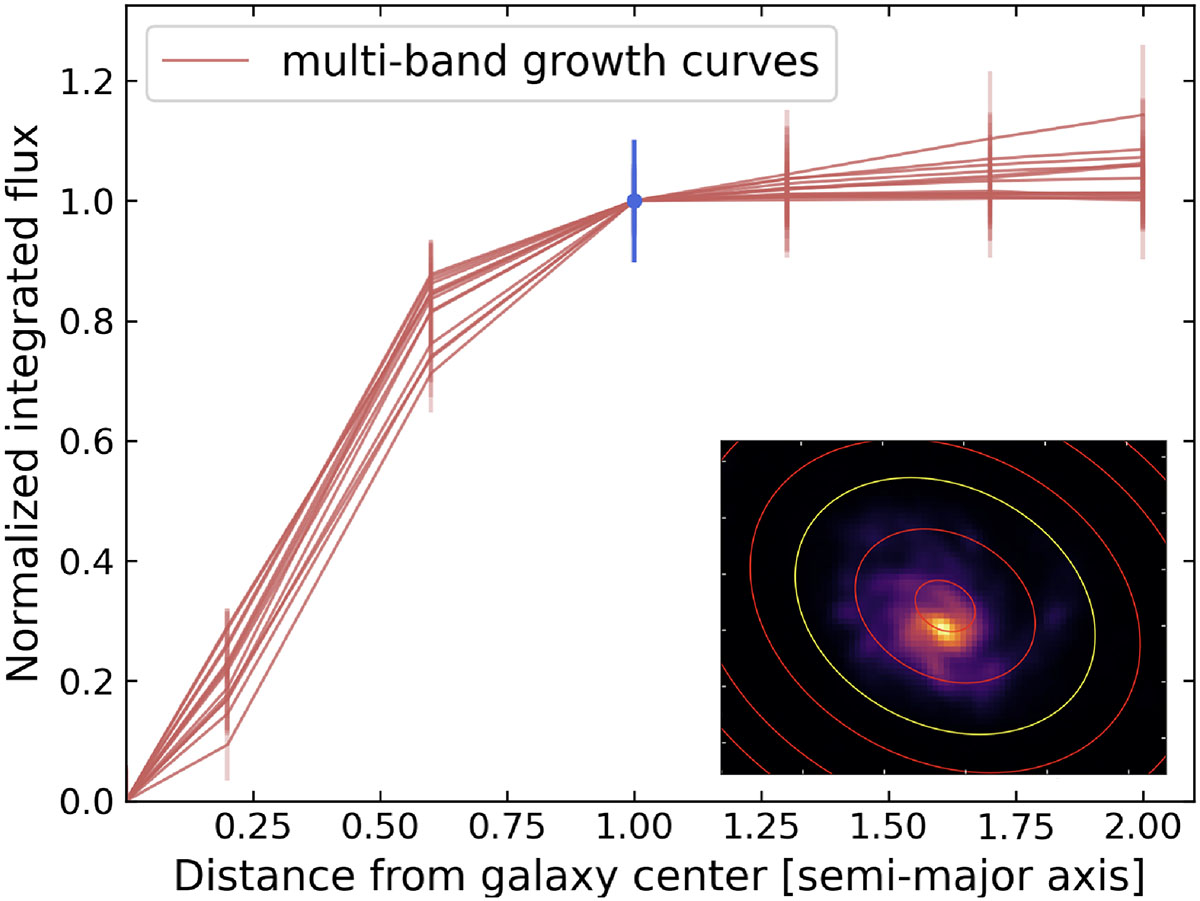
Fig. C.5.
Download original image
Multi-band growth curves built by HIP while computing the aperture photometry of M 99. Each measurement (red bars) was computed within larger and larger co-focal ellipses (shown in the inset, overlaid on the SPIRE 250 μm cutout), and then normalised to the corresponding integrated flux (blue dot). The latter was obtained integrating within the yellow ellipse in the inset (see Table 1). Vertical bars show the error (both RMS and flux calibration uncertainty) on the integrated flux. NIKA2 maps are not included here, since the sky subtraction is already performed during the data reduction with Scanam_nika. Planck/HFI4 growth curve is shown in Fig. A.4.
Current usage metrics show cumulative count of Article Views (full-text article views including HTML views, PDF and ePub downloads, according to the available data) and Abstracts Views on Vision4Press platform.
Data correspond to usage on the plateform after 2015. The current usage metrics is available 48-96 hours after online publication and is updated daily on week days.
Initial download of the metrics may take a while.