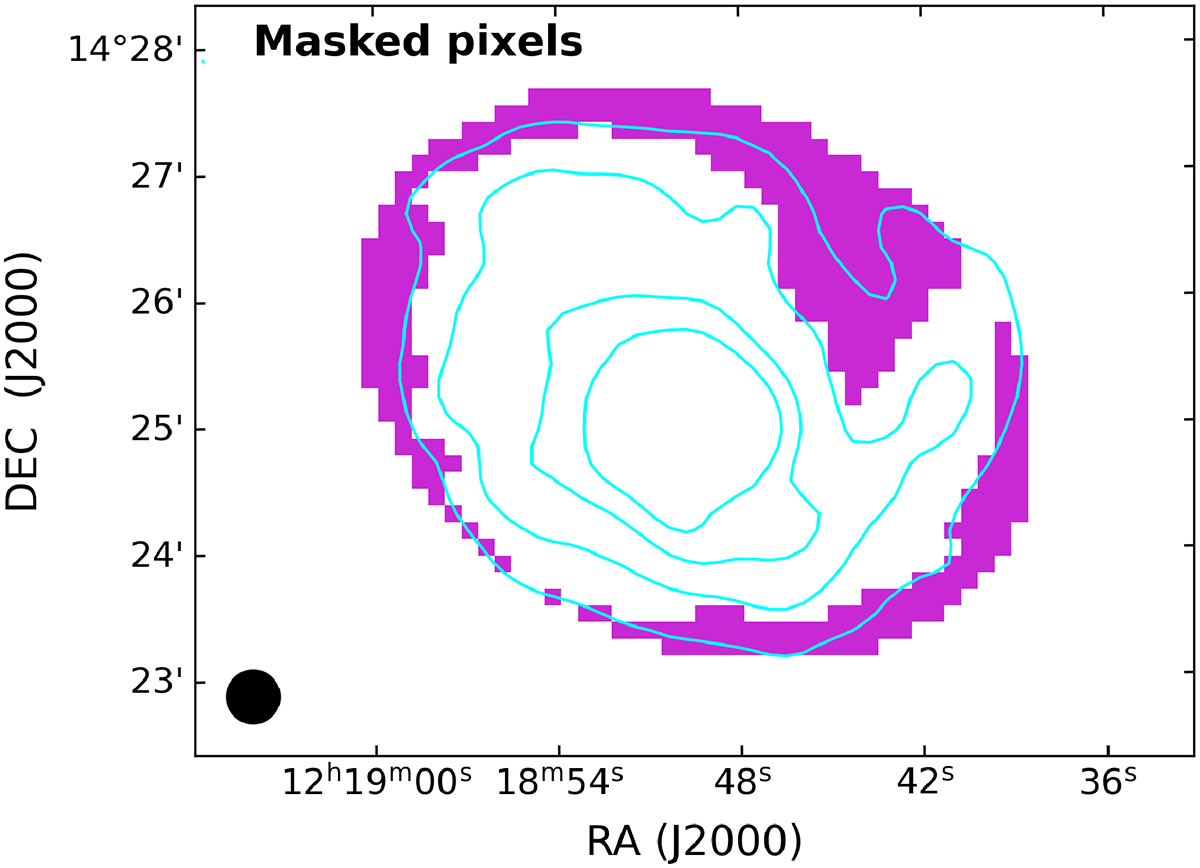
Fig. E.1.
Download original image
Magenta regions indicate areas with S/N < 3 in the NIKA2 maps, within the ellipse defining M 99’s geometry (Table 1). These low-S/N regions often show anomalous or extreme model parameter values. Cyan contours show SPIRE 350 μm emission at [5, 15, 35, 55]×σ. The same low-S/N pixels are marked in grey in Figs. 9 (left panel) and 10 for reference.
Current usage metrics show cumulative count of Article Views (full-text article views including HTML views, PDF and ePub downloads, according to the available data) and Abstracts Views on Vision4Press platform.
Data correspond to usage on the plateform after 2015. The current usage metrics is available 48-96 hours after online publication and is updated daily on week days.
Initial download of the metrics may take a while.